Wohnung mieten

Eigentumswohnungen zur Miete

Häuser zur Miete

Villen zur Miete

Apartments zur Miete

Wohnung kaufen

Eigentumswohnungen zum Kauf

Häuser zum Kauf

Villen zum Kauf

Grundstücke zum Kauf

Entdecken

Regionen

Navigieren Sie auf der interaktiven Karte von 77 Provinzen zu 928 Bezirken und 7.425 Unterbezirken und vergleichen Sie Immobilien, Preise, Projekte und lokale Ratgeber.

Projekte durchsuchen

Durchsuchen Sie Eigentumswohnungen, Wohnsiedlungen und Bauprojekte mit aktiven Angeboten

Immobilien nahe Verkehr, Schulen und Wahrzeichen

Wählen Sie einen Ort, der für Ihren Alltag wichtig ist, und vergleichen Sie aktuelle Miet- und Kaufangebote in der Nähe. Für jeden Ort unten gibt es aktive Angebote im Suchgebiet.

Vom Eigentümer freigegebene Möglichkeiten

Entdecken Sie Immobilien, deren Eigentümer einen Preis bestätigt haben und gesprächsbereit sind, auch wenn sie keine Verkaufseile haben.

Finden Sie einen Makler in Ihrer Nähe

Durchsuchen Sie verifizierte Immobilienmakler und Agenturen nach Provinz, mit aktiven Angeboten und Bewertungen.

Ressourcen

Ratgeber & Einblicke

Immobilienmarktbericht Thailand

Die Provinzen mit den meisten aktiven Angeboten im Netzwerk. Klicken Sie auf eine Provinz für den vollständigen Marktbericht.

Best-Of-Guides

Ausgewählte Empfehlungen für die besten Gebiete zum Kaufen, Mieten und Leben in Thailand

Visa-Möglichkeiten

Visatypen, Verlängerungen und Anträge für Thailand

Immobilienrecht in Thailand

Verständliche Ratgeber zum thailändischen Immobilienrecht, anhand amtlicher Quellen geprüft — für ausländische Käufer, thailändische Käufer und Mieter.

Hochwasser-Verlaufskarte Thailand

Kostenloses Tool: Prüfen Sie, ob eine Adresse, ein Soi oder ein Condo-Projekt in Thailand bereits einmal überflutet war, anhand historischer Satelliten-(SAR-)Hochwasserbeobachtungen.

Immobiliennachrichten

Aktuelle Änderungen zu Visa, Steuern und Immobilienrecht in Thailand, anhand amtlicher Quellen geprüft.

Alle Artikel

Tipps, Markteinblicke und Immobilienratgeber

Tools

Hypothekenrechner Thailand

Schätzen Sie die monatliche Rate eines Immobilienkredits anhand von Kaufpreis, Eigenkapital, Jahreszins und Laufzeit.

Übertragungsgebühren-Rechner

Steuern und Gebühren für Immobilienübertragungen in Thailand berechnen

Einheitenumrechnung

Umrechnung zwischen thailändischen und internationalen Flächeneinheiten

  • Eigentumswohnungen zur Miete
  • Häuser zur Miete
  • Villen zur Miete
  • Apartments zur Miete
  • Eigentumswohnungen zum Kauf
  • Häuser zum Kauf
  • Villen zum Kauf
  • Grundstücke zum Kauf
  • Regionen
  • Projekte durchsuchen
  • Immobilien nahe Verkehr, Schulen und Wahrzeichen
  • Vom Eigentümer freigegebene Möglichkeiten
  • Finden Sie einen Makler in Ihrer Nähe
  • Immobilienmarktbericht Thailand
  • Best-Of-Guides
  • Visa-Möglichkeiten
  • Immobilienrecht in Thailand
  • Hochwasser-Verlaufskarte Thailand
  • Immobiliennachrichten
  • Alle Artikel
  • Hypothekenrechner Thailand
  • Übertragungsgebühren-Rechner
  • Einheitenumrechnung

Warum BaanMe?

ID-verifizierte Makler

Jeder BaanMe-Makler wird anhand eines thailändischen Ausweisdokuments verifiziert, bevor er ein einziges Angebot veröffentlichen darf — so weißt du immer genau, mit wem du es zu tun hast, und Betrüger werden dauerhaft gesperrt.

Sicherer In-App-Chat (demnächst)

Wir entwickeln Nachrichten innerhalb der App. Bis zum Start hängen die Kontaktmöglichkeiten vom Makler und Inserat ab.

Kautionsschutz (bald verfügbar)

Bald wird BaanMe deine Kaution treuhänderisch verwalten und jede Forderung selbst prüfen — so werden unfaire Abzüge und verschwindende Vermieter der Vergangenheit angehören.

Unterstützung bei Verträgen

Fragen Sie Ihren Makler vor der Unterschrift nach verfügbaren Vertragssprachen und Bedingungen.

Umweltwirkung

Uns liegt deine, unsere und die Umwelt aller am Herzen. Deshalb setzen wir uns für die Wiederaufforstung des Regenwaldes in Pai, Thailand, ein — mit Unterstützung von Conserve Natural Forests, einer lokalen NGO, die sich für die Wiederherstellung der Wälder in und um Pai einsetzt.

Regionen

  • Immobilien in Bangkok
  • Immobilien in Chiang Mai
  • Immobilien in Samut Prakan
  • Immobilien in Phetchabun
  • Immobilien in Lamphun
  • Immobilien in Nonthaburi
  • Immobilien in Chiang Rai
  • Immobilien in Chon Buri

Immobilien durchsuchen

  • Kondos zur Miete in Bangkok
  • Wohnungen zur Miete in Bangkok
  • Häuser zur Miete in Chiang Mai
  • Büros zur Miete in Bangkok
  • Lagerhallen zur Miete in Bangkok
  • Häuser zur Miete auf Koh Samui
  • Alle Immobilien →

FAQ

  • Thailand Property Market Trends 2026: A Selective Recovery
  • Mehr →

BaanMe

  • Über BaanMe
  • Presseanfragen
  • Markenmaterial
  • Datenschutzerklärung
  • AGB
  • Kartenquellen
  • Hilfe
  • BaanMe bei Google als bevorzugte Quelle hinzufügen
  • Konto löschen

© Niklas Benjamin Muegge, 2026

  1. Startseite
  2. Supalai Ville Surat Thani
Supalai Ville Surat Thani
ÜbersichtLageBewertungVerfügbare WohnungenProjekte in der Nähe

Supalai Ville Surat Thani

Verfügbare Wohnungen ansehen
In Supalai Ville Surat Thani

Lage

Surat Thani

Kalkstein-Karstgelände in der Nähe (Geologie, keine Risikobewertung)

90 Min.

nach Cha Ian Airport

Fahrzeit

5 Min.

Surat Thani

Arbeitsweg prüfen

Orte speichern und Fahrzeiten von diesem Zuhause vergleichen.

Umgebung
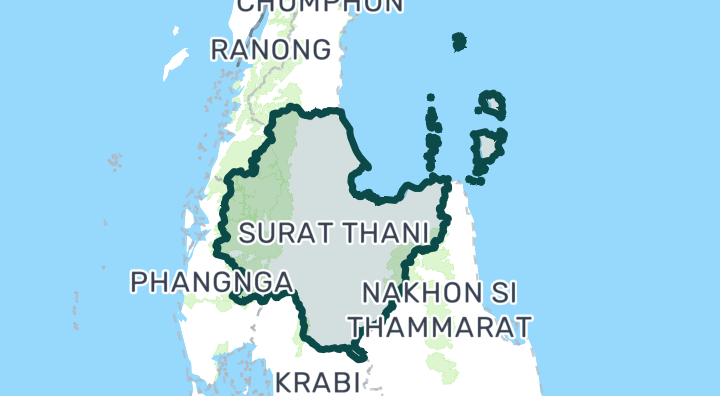
Surat Thani

Surat Thani

Surat Thani is Thailand's largest southern province, but its real estate appeal centers on its stunning Gulf of Thailand islands — particularly Koh Samui and Koh Pha-Ngan. Samui has matured into a luxury island destination with a well-established villa market, international dining, and its own airport. Pha-Ngan, famous for the Full Moon Party, is rapidly developing a more upscale property scene while retaining its bohemian character. Koh Samui — The main island. Established luxury villa market, international airport, premium resorts. Chaweng and Lamai are tourist-oriented; Bophut (Fisherman's Village) is charming and upscale; Maenam is quieter and family-friendly. The hills and west coast offer sea-view villas with more privacy. Koh Pha-Ngan — Smaller, less developed, and more affordable. Thong Sala is the main town. Sri Thanu and Haad Salad attract yoga/wellness communities. Rapidly growing interest from investors seeing it as "the next Samui." Mainland Surat Thani — The provincial capital is mainly a transit hub to the islands. Some affordable residential development along the coast at Don Sak and Kanchanadit. Villa buyers — Samui has Thailand's most mature island villa market with professional management options Wellness seekers — Pha-Ngan's yoga, detox, and mindfulness scene is world-class Holiday rental investors — Strong seasonal demand (Dec–Apr peak); managed villas can yield 6–10% gross Early-stage investors — Koh Pha-Ngan land/development is still affordable compared to Samui or Phuket Koh Samui pool villas range from 8–15 million THB (inland) to 20–80+ million THB (sea-view or beachfront). Samui condos are limited but start around 3–5 million THB. On Koh Pha-Ngan, villas start from 5–10 million THB and land from 3–8 million THB per rai depending on sea view and road access. Rental yields during high season are excellent but drop significantly May–October. Samui Airport (USM) is privately operated by Bangkok Airways, making flights more expensive than other Thai destinations. Surat Thani Airport (URT) on the mainland is cheaper and connects via ferry. Koh Pha-Ngan has no airport — access is by ferry from Samui (30 min) or the mainland (2–4 hours). On the islands, roads are hilly and motorbike-dependent. Island land titles can be complicated — many plots have Nor Sor 3 Gor titles rather than full Chanote. Always conduct thorough due diligence with a local lawyer. Construction costs on islands are 20–40% higher than the mainland due to logistics. Monsoon season (Oct–Dec) brings heavy rain to the Gulf coast — the opposite schedule from Phuket/Andaman side. Samui has good private hospitals; Pha-Ngan's medical facilities are more limited — serious cases evacuate to Samui or Surat Thani.

Surat Thani entdecken

Standortrisiken & Umgebungsdaten

FlusshochwasserMittel(geschätzt)
SturzflutNiedrig(geschätzt)
DürreMittel(basierend auf der Umgebung)
schlechte LuftqualitätNoch nicht genug Daten(Grundlage nicht verfügbar)
BrandrisikoNoch nicht genug Daten(Grundlage nicht verfügbar)
extreme HitzeNoch nicht genug Daten(Grundlage nicht verfügbar)
Flusshochwasser
Höhe über dem nächsten Abflussweg: 5.4851133995768135 m. Dies ist ein indirekter Prüfungsindikator.
Räumlicher Bezug: Modellbasierte Vorprüfung · Konfidenz: Mittel
Sturzflut
Geländeabhängige Anfälligkeitsstufe: Minimal. Keine Prognose der Überflutungstiefe.
Räumlicher Bezug: Modellbasierte Vorprüfung · Konfidenz: Hoch
Dürre
In 15% der analysierten 10-Tage-Zeiträume lag der Regen unter dem lokalen Normalwert. Regionale Prüfung mit projektspezifischen Schwellen.
Räumlicher Bezug: Gebietskontext · Konfidenz: Mittel
Luftqualität
Keine verwertbaren Daten verfügbar.
Räumlicher Bezug: Unzureichende Daten
Brand
Keine verwertbaren Daten verfügbar.
Räumlicher Bezug: Unzureichende Daten
Hitze
Keine verwertbaren Daten verfügbar.
Räumlicher Bezug: Unzureichende Daten

Hochwasser

Flusshochwasser

Für diesen Standort liegt noch keine Satellitenbeobachtung zu Hochwasser vor

Das Flusshochwasserrisiko wird ausschließlich anhand eines einzigen, satellitengestützt beobachteten Hochwasserereignisses aus 2024 bewertet, das vier nordthailändische Provinzen abdeckt (Chiang Mai, Chiang Rai, Lamphun, Phayao). „Unbekannt“ außerhalb dieses Gebiets bedeutet, dass noch keine Beobachtung vorliegt — nicht, dass das Gebiet sicher ist.

Sturzflut

Minimal — flaches Gelände, weit entfernt von Wasserläufen

Konfidenz: hoch

  • Höhe über der nächsten Entwässerung: 5.5 m
  • Entfernung zum nächsten Wasserlauf: 3875 m
  • Hangneigung: 0.1%

Die Geländedaten für Sturzfluten stammen aus OpenStreetMap-Wasserlaufdaten. OpenStreetMap-Quellenangabe ansehen

Umgebungsdaten

Amtliche Baukostenschätzung, Maximum
12.500 THB/m² — In der Provinz Surat Thani
Quelle: Treasury Department (กรมธนารักษ์) construction cost appraisal · Lizenz: Open Data Common (Treasury Department building valuation catalogue) · 2024-08-15 bis 2027-12-31
Amtliche Baukostenschätzung, typisch
7.500 THB/m² — In der Provinz Surat Thani
Quelle: Treasury Department (กรมธนารักษ์) construction cost appraisal · Lizenz: Open Data Common (Treasury Department building valuation catalogue) · 2024-08-15 bis 2027-12-31
Amtliche Baukostenschätzung, Minimum
450 THB/m² — In der Provinz Surat Thani
Quelle: Treasury Department (กรมธนารักษ์) construction cost appraisal · Lizenz: Open Data Common (Treasury Department building valuation catalogue) · 2024-08-15 bis 2027-12-31
Amtliche Bodenbewertung (Gemeinde), Maximum — amtlicher Schätzwert, kein Marktpreis
7.500 THB/sq_wah — Im Unterbezirk Tha Thong Mai
Quelle: Treasury Department (กรมธนารักษ์) land valuation (ราคาประเมินที่ดิน) - attach_all_20240805.csv — เทศบาลตำบลท่าทองใหม่ (municipal area) · Lizenz: Open Data Common · 2024-08-14 bis 2024-08-14
Amtliche Bodenbewertung (Gemeinde), typisch — amtlicher Schätzwert, kein Marktpreis
1.000 THB/sq_wah — Im Unterbezirk Tha Thong Mai
Quelle: Treasury Department (กรมธนารักษ์) land valuation (ราคาประเมินที่ดิน) - attach_all_20240805.csv — เทศบาลตำบลท่าทองใหม่ (municipal area) · Lizenz: Open Data Common · 2024-08-14 bis 2024-08-14
Amtliche Bodenbewertung (Gemeinde), Minimum — amtlicher Schätzwert, kein Marktpreis
300 THB/sq_wah — Im Unterbezirk Tha Thong Mai
Quelle: Treasury Department (กรมธนารักษ์) land valuation (ราคาประเมินที่ดิน) - attach_all_20240805.csv — เทศบาลตำบลท่าทองใหม่ (municipal area) · Lizenz: Open Data Common · 2024-08-14 bis 2024-08-14
Amtliche Bodenbewertung (Subdistrikt), Maximum — amtlicher Schätzwert, kein Marktpreis
7.500 THB/sq_wah — Im Unterbezirk Tha Thong Mai
Quelle: Treasury Department (กรมธนารักษ์) land valuation (ราคาประเมินที่ดิน) - attach_all_20240805.csv · Lizenz: Open Data Common · 2024-08-14 bis 2024-08-14
Amtliche Bodenbewertung (Subdistrikt), typisch — amtlicher Schätzwert, kein Marktpreis
625 THB/sq_wah — Im Unterbezirk Tha Thong Mai
Quelle: Treasury Department (กรมธนารักษ์) land valuation (ราคาประเมินที่ดิน) - attach_all_20240805.csv · Lizenz: Open Data Common · 2024-08-14 bis 2024-08-14
Amtliche Bodenbewertung (Subdistrikt), Minimum — amtlicher Schätzwert, kein Marktpreis
250 THB/sq_wah — Im Unterbezirk Tha Thong Mai
Quelle: Treasury Department (กรมธนารักษ์) land valuation (ราคาประเมินที่ดิน) - attach_all_20240805.csv · Lizenz: Open Data Common · 2024-08-14 bis 2024-08-14
Trockenster Monat
Februar — In der Provinz Surat Thani
Quelle: Open-Meteo (ERA5 reanalysis, via archive-api.open-meteo.com) · Lizenz: CC BY 4.0 (Attribution 4.0 International) -- https://open-meteo.com/en/licence · 1991-01-01 bis 2020-12-31
Climate rainfall annual total mean mm
1.732,4 mm — In der Provinz Surat Thani
Quelle: Open-Meteo (ERA5 reanalysis, via archive-api.open-meteo.com) · Lizenz: CC BY 4.0 (Attribution 4.0 International) -- https://open-meteo.com/en/licence · 1991-01-01 bis 2020-12-31
Regenreichster Monat
Oktober — In der Provinz Surat Thani
Quelle: Open-Meteo (ERA5 reanalysis, via archive-api.open-meteo.com) · Lizenz: CC BY 4.0 (Attribution 4.0 International) -- https://open-meteo.com/en/licence · 1991-01-01 bis 2020-12-31
Höhe über der nächsten Entwässerung (typisch)
2 m — Im Unterbezirk Tha Thong Mai
Quelle: Terrain-derived flash-flood indicators (HAND + slope + OSM drainage proximity; NOT a forecast or probability, not calibrated against observed events) from Copernicus DEM GLO-30 (via Mapterhorn terrain tiles) and OpenStreetMap waterway data. The banded metric flags whether the region CONTAINS terrain susceptible to flash flooding somewhere within it -- not the susceptibility of the region as a whole, and not of any individual property. · Lizenz: Copernicus WorldDEM-30 Licence, commercial use permitted (see ./region-elevation.ts's ELEVATION_SOURCE_LICENSE for the full citation) combined with OpenStreetMap contributors: ODbL 1.0 (https://www.openstreetmap.org/copyright) · 2010-12-12 bis 2015-01-07
Höhe über der nächsten Entwässerung (niedrigste 10%)
1 m — Im Unterbezirk Tha Thong Mai
Quelle: Terrain-derived flash-flood indicators (HAND + slope + OSM drainage proximity; NOT a forecast or probability, not calibrated against observed events) from Copernicus DEM GLO-30 (via Mapterhorn terrain tiles) and OpenStreetMap waterway data. The banded metric flags whether the region CONTAINS terrain susceptible to flash flooding somewhere within it -- not the susceptibility of the region as a whole, and not of any individual property. · Lizenz: Copernicus WorldDEM-30 Licence, commercial use permitted (see ./region-elevation.ts's ELEVATION_SOURCE_LICENSE for the full citation) combined with OpenStreetMap contributors: ODbL 1.0 (https://www.openstreetmap.org/copyright) · 2010-12-12 bis 2015-01-07
Hangneigung (typisch)
0,2% — Im Unterbezirk Tha Thong Mai
Quelle: Terrain-derived flash-flood indicators (HAND + slope + OSM drainage proximity; NOT a forecast or probability, not calibrated against observed events) from Copernicus DEM GLO-30 (via Mapterhorn terrain tiles) and OpenStreetMap waterway data. The banded metric flags whether the region CONTAINS terrain susceptible to flash flooding somewhere within it -- not the susceptibility of the region as a whole, and not of any individual property. · Lizenz: Copernicus WorldDEM-30 Licence, commercial use permitted (see ./region-elevation.ts's ELEVATION_SOURCE_LICENSE for the full citation) combined with OpenStreetMap contributors: ODbL 1.0 (https://www.openstreetmap.org/copyright) · 2010-12-12 bis 2015-01-07
Hangneigung (steilste 10%)
0,6% — Im Unterbezirk Tha Thong Mai
Quelle: Terrain-derived flash-flood indicators (HAND + slope + OSM drainage proximity; NOT a forecast or probability, not calibrated against observed events) from Copernicus DEM GLO-30 (via Mapterhorn terrain tiles) and OpenStreetMap waterway data. The banded metric flags whether the region CONTAINS terrain susceptible to flash flooding somewhere within it -- not the susceptibility of the region as a whole, and not of any individual property. · Lizenz: Copernicus WorldDEM-30 Licence, commercial use permitted (see ./region-elevation.ts's ELEVATION_SOURCE_LICENSE for the full citation) combined with OpenStreetMap contributors: ODbL 1.0 (https://www.openstreetmap.org/copyright) · 2010-12-12 bis 2015-01-07
Entfernung zum nächsten Wasserlauf (typisch)
2.282,8 m — Im Unterbezirk Tha Thong Mai
Quelle: Terrain-derived flash-flood indicators (HAND + slope + OSM drainage proximity; NOT a forecast or probability, not calibrated against observed events) from Copernicus DEM GLO-30 (via Mapterhorn terrain tiles) and OpenStreetMap waterway data. The banded metric flags whether the region CONTAINS terrain susceptible to flash flooding somewhere within it -- not the susceptibility of the region as a whole, and not of any individual property. · Lizenz: Copernicus WorldDEM-30 Licence, commercial use permitted (see ./region-elevation.ts's ELEVATION_SOURCE_LICENSE for the full citation) combined with OpenStreetMap contributors: ODbL 1.0 (https://www.openstreetmap.org/copyright) · 2010-12-12 bis 2015-01-07
Entfernung zum nächsten Wasserlauf (nächste 10%)
683,9 m — Im Unterbezirk Tha Thong Mai
Quelle: Terrain-derived flash-flood indicators (HAND + slope + OSM drainage proximity; NOT a forecast or probability, not calibrated against observed events) from Copernicus DEM GLO-30 (via Mapterhorn terrain tiles) and OpenStreetMap waterway data. The banded metric flags whether the region CONTAINS terrain susceptible to flash flooding somewhere within it -- not the susceptibility of the region as a whole, and not of any individual property. · Lizenz: Copernicus WorldDEM-30 Licence, commercial use permitted (see ./region-elevation.ts's ELEVATION_SOURCE_LICENSE for the full citation) combined with OpenStreetMap contributors: ODbL 1.0 (https://www.openstreetmap.org/copyright) · 2010-12-12 bis 2015-01-07
Geländeanfälligkeit für Sturzfluten
niedrig — Im Unterbezirk Tha Thong Mai
Quelle: Terrain-derived flash-flood indicators (HAND + slope + OSM drainage proximity; NOT a forecast or probability, not calibrated against observed events) from Copernicus DEM GLO-30 (via Mapterhorn terrain tiles) and OpenStreetMap waterway data. The banded metric flags whether the region CONTAINS terrain susceptible to flash flooding somewhere within it -- not the susceptibility of the region as a whole, and not of any individual property. · Lizenz: Copernicus WorldDEM-30 Licence, commercial use permitted (see ./region-elevation.ts's ELEVATION_SOURCE_LICENSE for the full citation) combined with OpenStreetMap contributors: ODbL 1.0 (https://www.openstreetmap.org/copyright) · 2010-12-12 bis 2015-01-07
Höhenlage, Maximum
16,1 m — Im Unterbezirk Tha Thong Mai
Quelle: Mapterhorn terrain tiles (Copernicus DEM GLO-30 / WorldDEM-30, terrarium encoding, via tiles.mapterhorn.com) · Lizenz: Copernicus WorldDEM-30 Licence (COP-DEM-GLO-30-F, 'Global 30m Full, Free & Open' -- https://documentation.dataspace.copernicus.eu/APIs/SentinelHub/Data/DEM/resources/license/License-COPDEM-30.pdf); free of charge, reproduction/distribution/public-communication/adaptation all granted, commercial use permitted; required notice: "produced using Copernicus WorldDEM-30 © DLR e.V. 2010-2014 and © Airbus Defence and Space GmbH 2014-2018 provided under COPERNICUS by the European Union and ESA; all rights reserved." Tiles served by Mapterhorn (© Mapterhorn, https://mapterhorn.com/attribution) -- both notices required. · 2010-12-12 bis 2015-01-07
Höhenlage, typisch
2,2 m — Im Unterbezirk Tha Thong Mai
Quelle: Mapterhorn terrain tiles (Copernicus DEM GLO-30 / WorldDEM-30, terrarium encoding, via tiles.mapterhorn.com) · Lizenz: Copernicus WorldDEM-30 Licence (COP-DEM-GLO-30-F, 'Global 30m Full, Free & Open' -- https://documentation.dataspace.copernicus.eu/APIs/SentinelHub/Data/DEM/resources/license/License-COPDEM-30.pdf); free of charge, reproduction/distribution/public-communication/adaptation all granted, commercial use permitted; required notice: "produced using Copernicus WorldDEM-30 © DLR e.V. 2010-2014 and © Airbus Defence and Space GmbH 2014-2018 provided under COPERNICUS by the European Union and ESA; all rights reserved." Tiles served by Mapterhorn (© Mapterhorn, https://mapterhorn.com/attribution) -- both notices required. · 2010-12-12 bis 2015-01-07
Höhenlage, Minimum
1 m — Im Unterbezirk Tha Thong Mai
Quelle: Mapterhorn terrain tiles (Copernicus DEM GLO-30 / WorldDEM-30, terrarium encoding, via tiles.mapterhorn.com) · Lizenz: Copernicus WorldDEM-30 Licence (COP-DEM-GLO-30-F, 'Global 30m Full, Free & Open' -- https://documentation.dataspace.copernicus.eu/APIs/SentinelHub/Data/DEM/resources/license/License-COPDEM-30.pdf); free of charge, reproduction/distribution/public-communication/adaptation all granted, commercial use permitted; required notice: "produced using Copernicus WorldDEM-30 © DLR e.V. 2010-2014 and © Airbus Defence and Space GmbH 2014-2018 provided under COPERNICUS by the European Union and ESA; all rights reserved." Tiles served by Mapterhorn (© Mapterhorn, https://mapterhorn.com/attribution) -- both notices required. · 2010-12-12 bis 2015-01-07
Höhenlage, Spannweite
15,1 m — Im Unterbezirk Tha Thong Mai
Quelle: Mapterhorn terrain tiles (Copernicus DEM GLO-30 / WorldDEM-30, terrarium encoding, via tiles.mapterhorn.com) · Lizenz: Copernicus WorldDEM-30 Licence (COP-DEM-GLO-30-F, 'Global 30m Full, Free & Open' -- https://documentation.dataspace.copernicus.eu/APIs/SentinelHub/Data/DEM/resources/license/License-COPDEM-30.pdf); free of charge, reproduction/distribution/public-communication/adaptation all granted, commercial use permitted; required notice: "produced using Copernicus WorldDEM-30 © DLR e.V. 2010-2014 and © Airbus Defence and Space GmbH 2014-2018 provided under COPERNICUS by the European Union and ESA; all rights reserved." Tiles served by Mapterhorn (© Mapterhorn, https://mapterhorn.com/attribution) -- both notices required. · 2010-12-12 bis 2015-01-07
Anteil der 10-Tage-Perioden mit Niederschlagsdefizit (10 Jahre)
15% — Im Bezirk Kanchanadit
Quelle: Climate Hazards Center UC Santa Barbara & WFP -- Thailand: Rainfall Indicators at Subnational Level (HDX) · Lizenz: CC BY (Creative Commons Attribution International) · 2016-01-01 bis 2025-12-31
Stärkstes 3-Monats-Niederschlagsdefizit (10 Jahre)
16,5% — Im Bezirk Kanchanadit
Quelle: Climate Hazards Center UC Santa Barbara & WFP -- Thailand: Rainfall Indicators at Subnational Level (HDX) · Lizenz: CC BY (Creative Commons Attribution International) · 2016-01-01 bis 2025-12-31
Niederschlag der letzten 3 Monate im Vergleich zum Normalwert
82% — Im Bezirk Kanchanadit
Quelle: Climate Hazards Center UC Santa Barbara & WFP -- Thailand: Rainfall Indicators at Subnational Level (HDX) · Lizenz: CC BY (Creative Commons Attribution International) · 2026-07-01 bis 2026-09-21
Mehr über diese Umgebung erfahren

Diese Vorprüfung ist keine Sicherheitsgarantie, Prognose künftiger Risiken oder Vor-Ort-Prüfung.

Immobilienbewertungen

Noch keine Bewertungen — seien Sie der Erste.

Bewertungen

Bewertung abgeben

Anmeldung erforderlich. Eine Bewertung pro Projekt.

Melden Sie sich an, um eine Bewertung zu hinterlassen.

Projekte in der Nähe
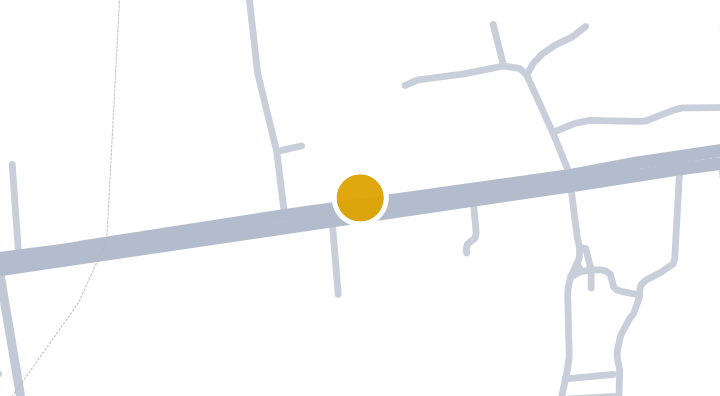
The Lake by Park Residence @Tatong Condominium in Thung Kong

The Lake by Park Residence @Tatong Condominium in Thung Kong

Eigentumswohnung
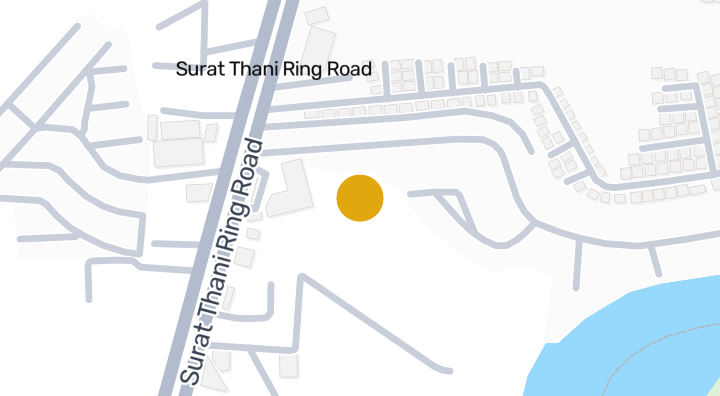
baan suay marina

baan suay marina

Eigentumswohnung

ST Mansion

ST Mansion

Eigentumswohnung

Green Home Resort - Surat Thani

Green Home Resort - Surat Thani

Eigentumswohnung
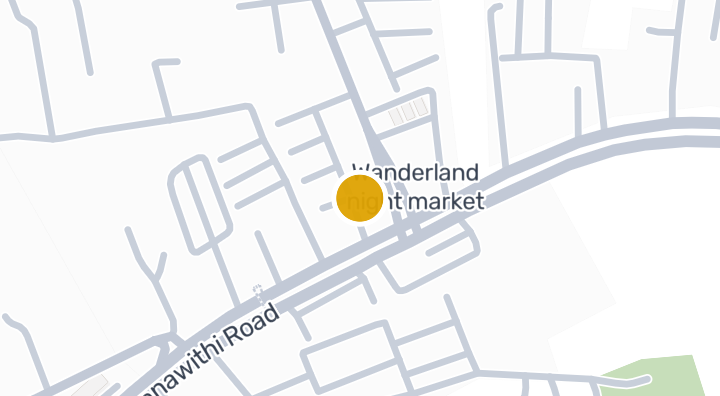
baan suay succeed 14

baan suay succeed 14

Eigentumswohnung
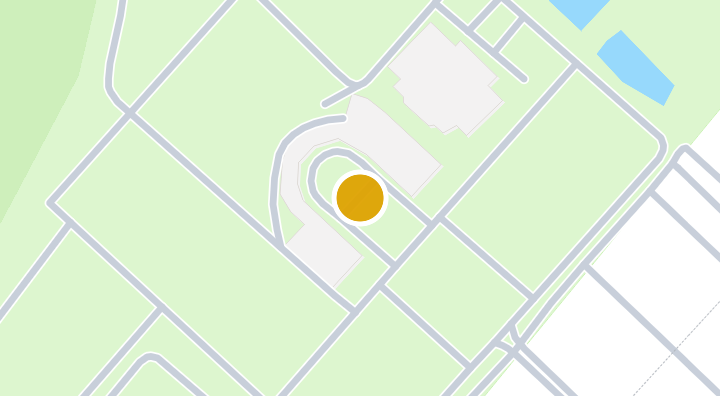
Kalpapruek Grand Condominium | Condominium in Mueang Surat,

Kalpapruek Grand Condominium | Condominium in Mueang Surat,

Eigentumswohnung
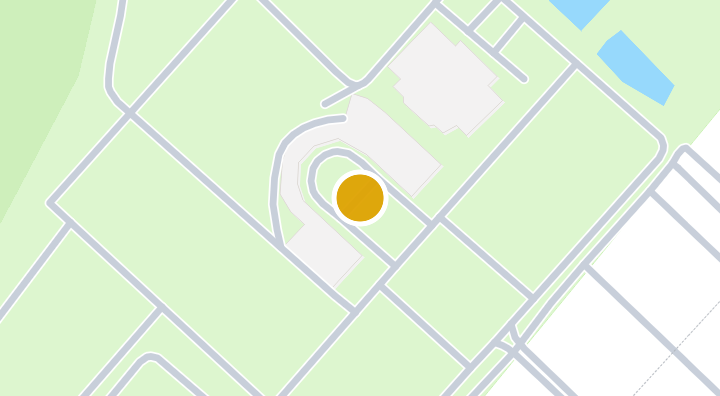
DB Garden

DB Garden

Eigentumswohnung

Baan Tai Fah

Baan Tai Fah

Eigentumswohnung

Ratchapruek Mansion

Ratchapruek Mansion

Eigentumswohnung

Tara Apartment

Tara Apartment

Eigentumswohnung

Condo Wassana City

Condo Wassana City

Eigentumswohnung

SB Apartment

SB Apartment

Eigentumswohnung

Erhalte eine Benachrichtigung, wenn neue Einheiten in Supalai Ville Surat Thani verfügbar werden.

Verfügbare Wohnungen ansehen
In Supalai Ville Surat Thani

Mehr entdecken

  • Immobilien durchsuchen

    BaanMe — Ihre vertrauenswürdige Plattform für Immobilienangebote, Markteinblicke und Marktanalysen.

  • Alle 77 Provinzen Thailands entdecken

    Navigieren Sie auf der interaktiven Karte von 77 Provinzen zu 928 Bezirken und 7.425 Unterbezirken und vergleichen Sie Immobilien, Preise, Projekte und lokale Ratgeber.

  • Immobilien nahe Verkehr, Schulen und Wahrzeichen

    Wählen Sie einen Ort, der für Ihren Alltag wichtig ist, und vergleichen Sie aktuelle Miet- und Kaufangebote in der Nähe. Für jeden Ort unten gibt es aktive Angebote im Suchgebiet.

  • Immobilienmarktbericht Thailand

    Median-Angebotspreise aller aktiven Angebote in Thailand, in thailändischem Baht.