7
Active Listings
5
For rent
2
For sale
—
Median Sale Price
—
Median Monthly Rent
—
Price per sqm
Properties in Tak
5 homes available

Get notified when new properties are listed in Tak.
Area profile: Tak
Everything we know about this area, from official Thai government and open sources.
Medians and yields appear only when each required price sample has at least 30 active listings. Prices are asking prices.
Market Overview
Price per sqm
| Property Type | Listings | Median Sale Price | Price per sqm | Median Monthly Rent | Yield |
|---|---|---|---|---|---|
| House | 7 | — | — | — | — |
Listings — Tak
Official land appraisal (municipal area)
Median appraisal
฿400 / sq. wah
Minimum appraisal฿80 / sq. wah
Median appraisal฿400 / sq. wah
Maximum appraisal฿18,000 / sq. wah
Land value ranges from ฿80 / sq. wah to ฿18,000 / sq. wah
Construction cost (province median)
Minimum appraisal฿400 / m²
Median appraisal฿7,250 / m²
Maximum appraisal฿13,000 / m²
Construction cost ranges from ฿400 / m² to ฿13,000 / m² per m²
People
704,494+4.1% since 2021
Gender split
Registered population (male)51%
Registered population (female)49%
Registered houses
246,226
Population density
40.8 people / km²
People per house
2.9
Environment
Air quality
Province-level reading
PM2.5 annual mean
39.1 µg/m³
WHO guideline: 5 µg/m³ PM2.5 / 15 µg/m³ PM10. Thai standard: 15 µg/m³ PM2.5 / 50 µg/m³ PM10.
Satellite fire detections
Province-level reading
Detections this year
8,164 detections
Monthly satellite fire detections
JanFebMarAprMayJunJulAugSepOctNovDec
Monthly satellite fire detections: Jan 893 detections, Feb 2,018 detections, Mar 4,668 detections, Apr 446 detections, May 139 detectionsTerrain & climate
Minimum elevation121.6 m
Median elevation508.3 m
Maximum elevation997.8 m
Elevation ranges from 121.6 m to 997.8 m
Elevation range
876.2 m
Monthly rainfall
1,901 mm / year
JanFebMarAprMayJunJulAugSepOctNovDec
Average monthly rainfall: Jan 19 mm, Feb 17 mm, Mar 59 mm, Apr 126 mm, May 239 mm, Jun 275 mm, Jul 309 mm, Aug 327 mm, Sep 305 mm, Oct 174 mm, Nov 37 mm, Dec 13 mmFlood exposure
Check a specific address on the flood history map
Flash-flood terrain susceptibility
MinimalLowModerateHigh
Flash-flood terrain susceptibility band: Low2024 observed exposure
Not assessedNone observedLowModerateHigh
2024 flood exposure band: LowLess than half of this area could be assessed by satellite during the 2024 event, so this reading is incomplete — it does not mean the rest of the area stayed dry.
Sinkhole susceptibility (DMR)
LowMediumHighVery high
Sinkhole susceptibility: Very highObserved flooded area (2024)
0%
Satellite-analysed coverage
0.1%
Height above nearest drainage (10th percentile)
-119.8 m
Distance to nearest stream (10th percentile)
1,431.7 m
Terrain slope (90th percentile)
1.3%
Drought
Rainfall deficit vs 1981–2010+ normal (CHIRPS) — a meteorological reading, not soil moisture, and not a forecast.
Latest 3-month rainfall vs normal
116.3%
Share of 10-day periods in deficit (10y)
16.7%
Worst 3-month deficit (10y)
25.3%
Air quality
PM2.5 — OpenAQ
Reference-grade station
39.1 µg/m³
Fire hotspots
Annual detections
8,164 detections
- Conservation forest4,800 detections
- Reserved forest2,876 detections
- Agricultural land102 detections
- Agrarian reform land188 detections
- Community & other184 detections
- Highway corridor14 detections
Amenities in Tak
What's within reach — shops, schools, transit and more.
68
Shopping
296
Education
45
Health
3
Transport
64
Leisure
202
Services
11
Nature
216
food
11
nightlife
Shopping centers(2)Show
Supermarkets(5)Show
Hospitals(5)Show
Parks(5)Show
Gyms(1)Show
Universities(1)Show
Amenity data © OpenStreetMap contributors
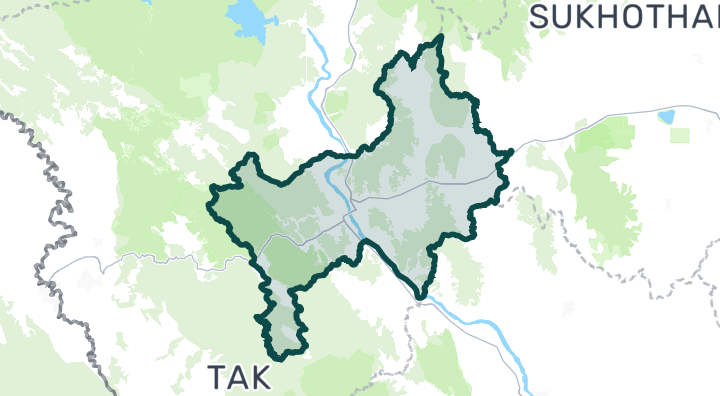
Map of Tak
Tap a region to drill into its districts and subdistricts.
Explore Tak
Top districts by listings
Mueang Tak
10 homes available
Property projects in Tak
Explore condo and housing projects with homes available in this location.
Explore more
Browse Projects
Condos, housing estates, and developments across Thailand with listings available now.
Homes near transit, schools and landmarks
Choose a place that matters to your daily life, then compare live rentals and homes for sale nearby. Every place below has active inventory in its search area.
Thailand Property Market Report
Median asking prices across all active listings in Thailand, in Thai Baht.
Browse Properties in Tak
Find exactly what you're looking for
Frequently asked about Tak
How many properties are for sale and rent in Tak?
There are 7 active property listings in Tak on the BaanMe network — 2 listed for sale and 5 available for rent (a property listed on both sides counts once in each figure).
What's near Tak?
Tak has 9 supermarkets, 2 shopping centers, 31 hospitals, 11 parks, and 192 restaurants and cafés nearby, based on OpenStreetMap data. Nearby options include Robinson Lifestyle Center, Landfair Shopping Mall, and โรงพยาบาลพบพระ.
What's the air quality like in Tak?
Tak's annual mean PM2.5 is 39.1 µg/m³, against a WHO guideline of 5 µg/m³ and a Thai standard of 15 µg/m³. This is a Province-level-level reading, not a station within the area itself.
Is Tak at risk of flooding?
Tak's 2024 observed flood exposure was Low. Flash-flood terrain susceptibility is Low. Sinkhole susceptibility (DMR survey) is Very high.
What's the population of Tak?
Tak has a registered population of 704,494 (+4.1% since 2021).
What is the official land appraisal price in Tak?
The Treasury Department's official land appraisal for Tak (this subdistrict) is ฿400 per square wah (median) — an assessed value used for transfer fees and taxes, not a market price.
Did Tak flood in 2024?
Satellite monitoring of the 2024 monsoon season observed Low flood exposure in Tak. This reflects what was observed during that specific event, not a general flood-risk forecast.
How much rain does Tak get?
Tak receives an average of 1,901 mm of rainfall per year, based on long-term climate data.
How bad is air pollution in Tak?
According to OpenAQ reference-grade monitoring stations, the annual mean PM2.5 level in Tak is 39.1 µg/m³.