집 임대하기

임대 콘도

임대 주택

임대 빌라

임대 아파트

집 구매하기

매매 콘도

매매 주택

매매 빌라

매매 토지

둘러보기

지역

인터랙티브 지도에서 77개 주부터 928개 군과 7,425개 하위 지역까지 이동하며 현지 주택, 가격, 프로젝트와 지역 가이드를 비교하세요.

프로젝트 둘러보기

활성 매물이 있는 콘도, 주택 단지 및 개발 프로젝트를 검색하세요

교통, 학교 및 랜드마크 인근 주택

일상에 중요한 장소를 선택한 뒤 근처의 최신 임대 및 매매 주택을 비교하세요. 아래 모든 장소의 검색 범위에는 실제 등록 매물이 있습니다.

소유자가 승인한 매각 기회

가격을 확인하고 상담할 의향이 있는 소유자의 부동산을 살펴보세요. 매각을 서두르지 않는 소유자도 포함됩니다.

가까운 중개인을 찾아보세요

지역별로 검증된 부동산 중개인 및 중개업체를 활성 매물과 리뷰와 함께 둘러보세요.

자료실

가이드 및 인사이트

태국 부동산 시장 리포트

네트워크 내 활성 매물이 가장 많은 주입니다. 주를 클릭하면 전체 시장 리포트를 볼 수 있습니다.

베스트 가이드

태국에서 매매, 임대, 거주하기 좋은 지역 추천

비자 정보

태국 비자 종류, 연장 및 신청 안내

태국 부동산법

공식 출처를 통해 검증한 외국인 구매자, 태국인 구매자 및 임차인을 위한 알기 쉬운 태국 부동산법 가이드.

태국 홍수 이력 지도

무료 도구: 과거 위성(SAR) 홍수 관측 데이터를 이용해 태국의 주소, 소이, 콘도 프로젝트가 이전에 침수된 적이 있는지 확인하세요.

부동산 뉴스

공식 출처를 통해 검증한 태국 비자, 세금 및 부동산법의 최신 변경 사항.

전체 아티클

팁, 시장 동향, 부동산 가이드

도구

태국 주택담보대출 계산기

입력한 부동산 가격, 계약금, 연이율, 대출 기간으로 월 상환액을 계산해 보세요.

소유권 이전 비용 계산기

태국 부동산 이전 시 세금과 비용 예상

단위 변환

태국식 토지 단위와 국제 단위 간 변환

  • 임대 콘도
  • 임대 주택
  • 임대 빌라
  • 임대 아파트
  • 매매 콘도
  • 매매 주택
  • 매매 빌라
  • 매매 토지
  • 지역
  • 프로젝트 둘러보기
  • 교통, 학교 및 랜드마크 인근 주택
  • 소유자가 승인한 매각 기회
  • 가까운 중개인을 찾아보세요
  • 태국 부동산 시장 리포트
  • 베스트 가이드
  • 비자 정보
  • 태국 부동산법
  • 태국 홍수 이력 지도
  • 부동산 뉴스
  • 전체 아티클
  • 태국 주택담보대출 계산기
  • 소유권 이전 비용 계산기
  • 단위 변환

왜 BaanMe인가요?

신원 인증 중개인

모든 BaanMe 중개인은 매물을 등록하기 전에 태국 정부 발급 신분증으로 신원을 인증받습니다 — 항상 상대방이 누구인지 정확히 알 수 있으며, 문제를 일으킨 사용자는 영구적으로 제재됩니다.

안전한 앱 내 채팅 (출시 예정)

앱 내 메시지 기능을 개발 중입니다. 출시 전 연락 방법은 중개인과 매물에 따라 다릅니다.

보증금 보호 (출시 예정)

곧 BaanMe가 보증금을 에스크로로 안전하게 보관하고 모든 청구를 직접 검토합니다 — 부당한 공제나 연락 불가한 임대인 문제를 방지합니다.

계약 지원

서명하기 전에 중개인에게 제공 가능한 계약 언어와 조건을 확인하세요.

환경적 영향

저희는 고객님, 저희, 그리고 모든 사람의 환경을 소중히 여깁니다. 그래서 태국 빠이(Pai) 지역의 산림 복원에 힘쓰는 현지 NGO인 Conserve Natural Forests와 함께 열대우림 재조림에 힘쓰고 있습니다.

지역

  • Bangkok 매물
  • Chiang Mai 매물
  • Samut Prakan 매물
  • Phetchabun 매물
  • Lamphun 매물
  • Nonthaburi 매물
  • Chiang Rai 매물
  • Chon Buri 매물

매물 둘러보기

  • 방콕 콘도 임대
  • 방콕 아파트 임대
  • 치앙마이 단독주택 임대
  • 방콕 사무실 임대
  • 방콕 창고 임대
  • 코사무이 단독주택 임대
  • 전체 매물 →

자주 묻는 질문

  • Thailand Property Market Trends 2026: A Selective Recovery
  • 더보기 →

BaanMe

  • BaanMe 소개
  • 언론 문의
  • 브랜드 자료
  • 개인정보 보호정책
  • 이용약관
  • 지도 출처
  • 도움말
  • Google에서 BaanMe를 선호 소스로 추가
  • 계정 삭제

© Niklas Benjamin Muegge, 2026

  1. 홈
  2. Sin Setthe Residence Town
Sin Setthe Residence Town
개요위치리뷰이용 가능한 콘도주변 프로젝트

Sin Setthe Residence Town

입주 가능 콘도 보기
Sin Setthe Residence Town 내

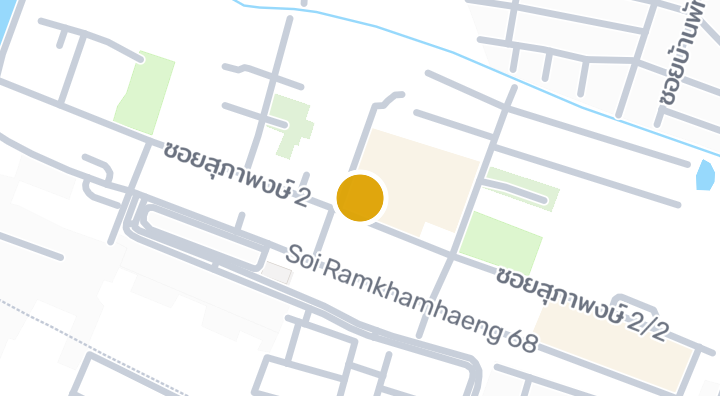
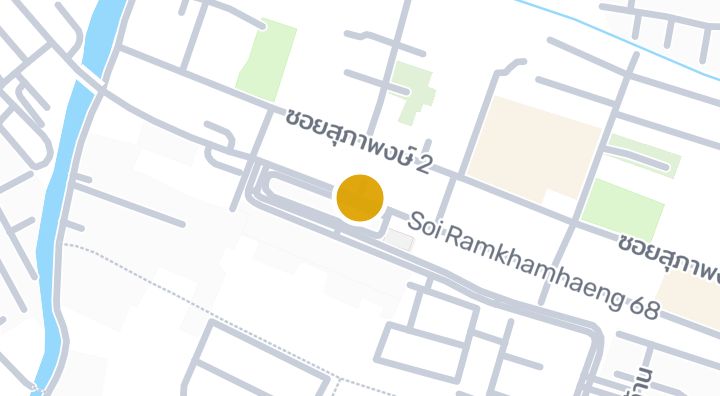
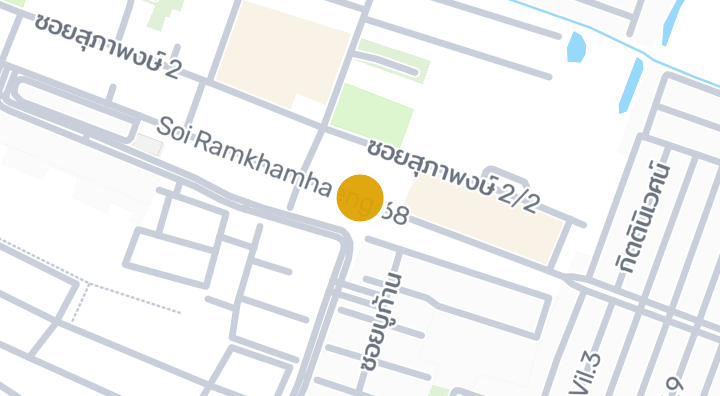
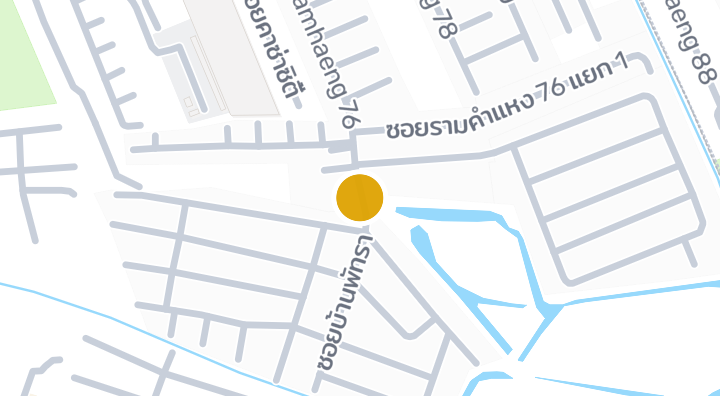
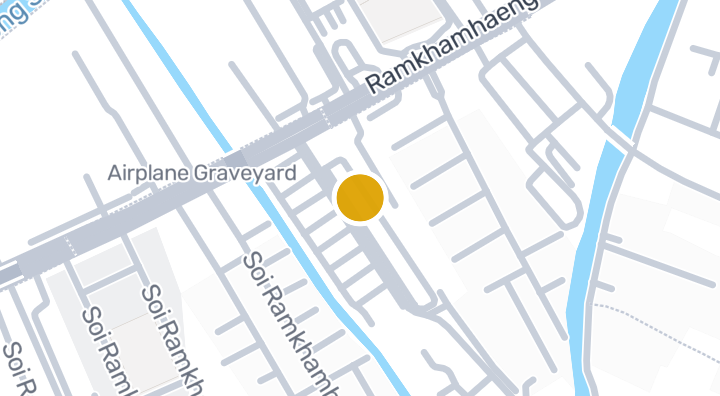
위치

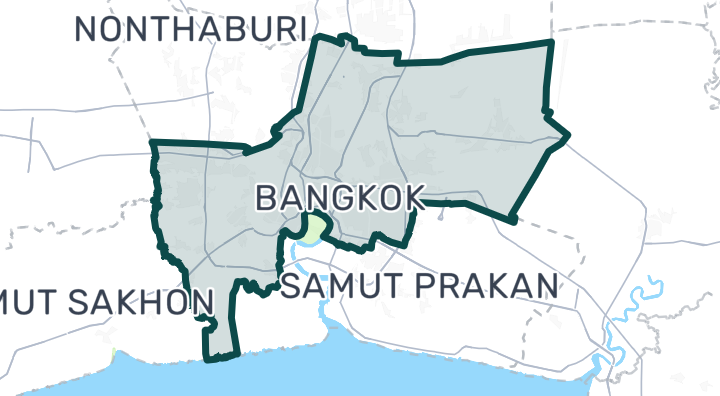
Bangkok

103분

Khao I-to Airport까지

이동 시간

3분

Bangkok

통근 시간 확인

장소를 저장하고 이 집에서의 이동 시간을 비교하세요.

주변 지역

Bangkok

Bangkok

Bangkok is Southeast Asia's most dynamic real estate market. The city blends ultra-modern skyscrapers with historic temples, world-class dining with street food, and sleek malls with floating markets. For property seekers, Bangkok offers unmatched variety — from luxury penthouses along the Chao Phraya river to affordable studio condos near BTS stations. Sukhumvit (Vadhana / Khlong Toei) — The expat corridor. Thong Lo, Ekkamai, and Phrom Phong are walkable, cafe-lined neighborhoods with international schools, fine dining, and easy BTS access. Premium pricing but high rental demand. Sathon / Silom — Bangkok's financial district. High-rise condos popular with professionals. Lumphini Park nearby. Strong rental yields from corporate tenants. Pathum Wan (Siam / Chidlom) — Dead center of the city. Luxury retail, top hotels, and prestigious condos. The most expensive per-sqm prices in Thailand. Chatuchak / Phaya Thai — Northern Bangkok, near BTS Mo Chit and Ari. Increasingly popular with young Thai professionals. More affordable than Sukhumvit with a trendy local vibe. Thon Buri / Bangkok Yai — West of the river. Quieter, more traditional, and significantly cheaper. Improving with new MRT extensions. Good value for long-term investment. Expat families — Sukhumvit corridor (international schools, hospitals, Western amenities) Young professionals — Ari, Thong Lo, Ekkamai (nightlife, coworking, transit access) Investors — Near BTS/MRT stations for strong rental yields (5–7% gross) Retirees — Riverside or suburban areas for quieter lifestyle at lower cost Central Bangkok condo prices range from 80,000–250,000+ THB/sqm depending on location and building age. Rental condos in Sukhumvit start around 15,000 THB/month for a studio, 25,000–50,000 THB for a 1-bed, and 40,000–120,000 THB for 2-bed units. Suburban areas can be 40–60% cheaper. Bangkok has an extensive transit network: the BTS Skytrain (2 lines), MRT (Blue and Yellow lines), Airport Rail Link to Suvarnabhumi, and a massive bus network. Properties near BTS/MRT stations command 20–30% premiums. Two international airports serve the city — Suvarnabhumi (BKK) and Don Mueang (DMK). Foreigners can own condos freehold (up to 49% of a building's total area). Houses/land require Thai company structures or leasehold. Traffic congestion is legendary — proximity to rail transit is the single most important factor for both livability and resale value. Bangkok has world-class private hospitals (Bumrungrad, Samitivej) that attract medical tourists regionally. The city experiences heavy flooding in some areas during monsoon season (Sep–Nov). Check flood maps before buying in low-lying areas.

Bangkok 둘러보기

입지 위험 및 주변 정보

하천 홍수높음(추정 기반)
돌발 홍수데이터 부족(근거 없음)
가뭄높음(주변 지역 기반)
대기질 악화보통(관측 기반)
화재 위험데이터 부족(근거 없음)
폭염낮음(주변 지역 기반)
하천 홍수
지역 배수로 대비 높이의 10백분위수는 -1.5122156901497137m입니다. 해당 필지가 아닌 지역 값입니다.
자료의 공간 범위: 주변 지역 배경 · 신뢰도: 낮음
돌발 홍수
분석 가능한 자료가 없습니다.
자료의 공간 범위: 자료 부족
가뭄
분석한 10일 기간의 20.555555555555554%에서 강수량이 지역 평년값보다 낮았습니다. 지역 등급은 프로젝트 기준을 사용합니다.
자료의 공간 범위: 주변 지역 배경 · 신뢰도: 보통
대기질
PM2.5 연평균은 21.4137936382034 µg/m³, 출처는 OpenAQ입니다. 현재 대기질 수치가 아닙니다.
자료의 공간 범위: 주변 지역 배경 · 신뢰도: 보통
화재
분석 가능한 자료가 없습니다.
자료의 공간 범위: 자료 부족
고온
월 최고기온의 연평균은 31.6985529589617 °C입니다. 지역 등급은 프로젝트 기준이며 개인 건강 예측이 아닙니다.
자료의 공간 범위: 주변 지역 배경 · 신뢰도: 보통

홍수

하천 범람

이 위치를 포함하는 위성 홍수 관측 데이터가 아직 없습니다

하천 범람 위험은 태국 북부 4개 주(치앙마이, 치앙라이, 람푼, 파야오)를 포함하는 2024년의 단일 위성 관측 홍수 사건만을 근거로 평가됩니다. 이 지역 밖에서 '알 수 없음'으로 표시되는 것은 아직 관측 데이터가 없다는 의미이며, 안전하다는 의미가 아닙니다.

돌발 홍수

아직 평가되지 않음

신뢰도: 낮음

  • 경사도: 0.7%

돌발 홍수 지형 데이터는 OpenStreetMap의 수로 데이터에서 가져왔습니다. OpenStreetMap 출처 표시 보기

주변 정보

정부 건설비 추정치, 최대
12,000 THB/m² — Bangkok 주 내
출처: Treasury Department (กรมธนารักษ์) construction cost appraisal · 라이선스: Open Data Common (Treasury Department building valuation catalogue) · 2024-08-15부터 2027-12-31까지
정부 건설비 추정치, 중앙값
7,950 THB/m² — Bangkok 주 내
출처: Treasury Department (กรมธนารักษ์) construction cost appraisal · 라이선스: Open Data Common (Treasury Department building valuation catalogue) · 2024-08-15부터 2027-12-31까지
정부 건설비 추정치, 최소
400 THB/m² — Bangkok 주 내
출처: Treasury Department (กรมธนารักษ์) construction cost appraisal · 라이선스: Open Data Common (Treasury Department building valuation catalogue) · 2024-08-15부터 2027-12-31까지
가장 건조한 달
12월 — Bangkok 주 내
출처: Open-Meteo (ERA5 reanalysis, via archive-api.open-meteo.com) · 라이선스: CC BY 4.0 (Attribution 4.0 International) -- https://open-meteo.com/en/licence · 1991-01-01부터 2020-12-31까지
Climate rainfall annual total mean mm
1,195.3 mm — Bangkok 주 내
출처: Open-Meteo (ERA5 reanalysis, via archive-api.open-meteo.com) · 라이선스: CC BY 4.0 (Attribution 4.0 International) -- https://open-meteo.com/en/licence · 1991-01-01부터 2020-12-31까지
평균 최고 기온
31.7 C — Bangkok 주 내
출처: Open-Meteo (ERA5 reanalysis, via archive-api.open-meteo.com) · 라이선스: CC BY 4.0 (Attribution 4.0 International) -- https://open-meteo.com/en/licence · 1991-01-01부터 2020-12-31까지
강수량이 가장 많은 달
9월 — Bangkok 주 내
출처: Open-Meteo (ERA5 reanalysis, via archive-api.open-meteo.com) · 라이선스: CC BY 4.0 (Attribution 4.0 International) -- https://open-meteo.com/en/licence · 1991-01-01부터 2020-12-31까지
가장 가까운 배수로 대비 높이 (중앙값)
0.5 m — Hua Mak 면/동 내
출처: Terrain-derived flash-flood indicators (HAND + slope + OSM drainage proximity; NOT a forecast or probability, not calibrated against observed events) from Copernicus DEM GLO-30 (via Mapterhorn terrain tiles) and OpenStreetMap waterway data. The banded metric flags whether the region CONTAINS terrain susceptible to flash flooding somewhere within it -- not the susceptibility of the region as a whole, and not of any individual property. · 라이선스: Copernicus WorldDEM-30 Licence, commercial use permitted (see ./region-elevation.ts's ELEVATION_SOURCE_LICENSE for the full citation) combined with OpenStreetMap contributors: ODbL 1.0 (https://www.openstreetmap.org/copyright) · 2010-12-12부터 2015-01-07까지
가장 가까운 배수로 대비 높이 (하위 10%)
-1.5 m — Hua Mak 면/동 내
출처: Terrain-derived flash-flood indicators (HAND + slope + OSM drainage proximity; NOT a forecast or probability, not calibrated against observed events) from Copernicus DEM GLO-30 (via Mapterhorn terrain tiles) and OpenStreetMap waterway data. The banded metric flags whether the region CONTAINS terrain susceptible to flash flooding somewhere within it -- not the susceptibility of the region as a whole, and not of any individual property. · 라이선스: Copernicus WorldDEM-30 Licence, commercial use permitted (see ./region-elevation.ts's ELEVATION_SOURCE_LICENSE for the full citation) combined with OpenStreetMap contributors: ODbL 1.0 (https://www.openstreetmap.org/copyright) · 2010-12-12부터 2015-01-07까지
지형 경사도 (중앙값)
0.2% — Hua Mak 면/동 내
출처: Terrain-derived flash-flood indicators (HAND + slope + OSM drainage proximity; NOT a forecast or probability, not calibrated against observed events) from Copernicus DEM GLO-30 (via Mapterhorn terrain tiles) and OpenStreetMap waterway data. The banded metric flags whether the region CONTAINS terrain susceptible to flash flooding somewhere within it -- not the susceptibility of the region as a whole, and not of any individual property. · 라이선스: Copernicus WorldDEM-30 Licence, commercial use permitted (see ./region-elevation.ts's ELEVATION_SOURCE_LICENSE for the full citation) combined with OpenStreetMap contributors: ODbL 1.0 (https://www.openstreetmap.org/copyright) · 2010-12-12부터 2015-01-07까지
지형 경사도 (급경사 10%)
0.5% — Hua Mak 면/동 내
출처: Terrain-derived flash-flood indicators (HAND + slope + OSM drainage proximity; NOT a forecast or probability, not calibrated against observed events) from Copernicus DEM GLO-30 (via Mapterhorn terrain tiles) and OpenStreetMap waterway data. The banded metric flags whether the region CONTAINS terrain susceptible to flash flooding somewhere within it -- not the susceptibility of the region as a whole, and not of any individual property. · 라이선스: Copernicus WorldDEM-30 Licence, commercial use permitted (see ./region-elevation.ts's ELEVATION_SOURCE_LICENSE for the full citation) combined with OpenStreetMap contributors: ODbL 1.0 (https://www.openstreetmap.org/copyright) · 2010-12-12부터 2015-01-07까지
가장 가까운 수로까지의 거리 (중앙값)
4,210.1 m — Hua Mak 면/동 내
출처: Terrain-derived flash-flood indicators (HAND + slope + OSM drainage proximity; NOT a forecast or probability, not calibrated against observed events) from Copernicus DEM GLO-30 (via Mapterhorn terrain tiles) and OpenStreetMap waterway data. The banded metric flags whether the region CONTAINS terrain susceptible to flash flooding somewhere within it -- not the susceptibility of the region as a whole, and not of any individual property. · 라이선스: Copernicus WorldDEM-30 Licence, commercial use permitted (see ./region-elevation.ts's ELEVATION_SOURCE_LICENSE for the full citation) combined with OpenStreetMap contributors: ODbL 1.0 (https://www.openstreetmap.org/copyright) · 2010-12-12부터 2015-01-07까지
가장 가까운 수로까지의 거리 (근접 10%)
2,414.4 m — Hua Mak 면/동 내
출처: Terrain-derived flash-flood indicators (HAND + slope + OSM drainage proximity; NOT a forecast or probability, not calibrated against observed events) from Copernicus DEM GLO-30 (via Mapterhorn terrain tiles) and OpenStreetMap waterway data. The banded metric flags whether the region CONTAINS terrain susceptible to flash flooding somewhere within it -- not the susceptibility of the region as a whole, and not of any individual property. · 라이선스: Copernicus WorldDEM-30 Licence, commercial use permitted (see ./region-elevation.ts's ELEVATION_SOURCE_LICENSE for the full citation) combined with OpenStreetMap contributors: ODbL 1.0 (https://www.openstreetmap.org/copyright) · 2010-12-12부터 2015-01-07까지
돌발 홍수에 대한 지형 취약성
낮음 — Hua Mak 면/동 내
출처: Terrain-derived flash-flood indicators (HAND + slope + OSM drainage proximity; NOT a forecast or probability, not calibrated against observed events) from Copernicus DEM GLO-30 (via Mapterhorn terrain tiles) and OpenStreetMap waterway data. The banded metric flags whether the region CONTAINS terrain susceptible to flash flooding somewhere within it -- not the susceptibility of the region as a whole, and not of any individual property. · 라이선스: Copernicus WorldDEM-30 Licence, commercial use permitted (see ./region-elevation.ts's ELEVATION_SOURCE_LICENSE for the full citation) combined with OpenStreetMap contributors: ODbL 1.0 (https://www.openstreetmap.org/copyright) · 2010-12-12부터 2015-01-07까지
고도, 최대
7.9 m — Hua Mak 면/동 내
출처: Mapterhorn terrain tiles (Copernicus DEM GLO-30 / WorldDEM-30, terrarium encoding, via tiles.mapterhorn.com) · 라이선스: Copernicus WorldDEM-30 Licence (COP-DEM-GLO-30-F, 'Global 30m Full, Free & Open' -- https://documentation.dataspace.copernicus.eu/APIs/SentinelHub/Data/DEM/resources/license/License-COPDEM-30.pdf); free of charge, reproduction/distribution/public-communication/adaptation all granted, commercial use permitted; required notice: "produced using Copernicus WorldDEM-30 © DLR e.V. 2010-2014 and © Airbus Defence and Space GmbH 2014-2018 provided under COPERNICUS by the European Union and ESA; all rights reserved." Tiles served by Mapterhorn (© Mapterhorn, https://mapterhorn.com/attribution) -- both notices required. · 2010-12-12부터 2015-01-07까지
고도, 중앙값
4.1 m — Hua Mak 면/동 내
출처: Mapterhorn terrain tiles (Copernicus DEM GLO-30 / WorldDEM-30, terrarium encoding, via tiles.mapterhorn.com) · 라이선스: Copernicus WorldDEM-30 Licence (COP-DEM-GLO-30-F, 'Global 30m Full, Free & Open' -- https://documentation.dataspace.copernicus.eu/APIs/SentinelHub/Data/DEM/resources/license/License-COPDEM-30.pdf); free of charge, reproduction/distribution/public-communication/adaptation all granted, commercial use permitted; required notice: "produced using Copernicus WorldDEM-30 © DLR e.V. 2010-2014 and © Airbus Defence and Space GmbH 2014-2018 provided under COPERNICUS by the European Union and ESA; all rights reserved." Tiles served by Mapterhorn (© Mapterhorn, https://mapterhorn.com/attribution) -- both notices required. · 2010-12-12부터 2015-01-07까지
고도, 최소
0.5 m — Hua Mak 면/동 내
출처: Mapterhorn terrain tiles (Copernicus DEM GLO-30 / WorldDEM-30, terrarium encoding, via tiles.mapterhorn.com) · 라이선스: Copernicus WorldDEM-30 Licence (COP-DEM-GLO-30-F, 'Global 30m Full, Free & Open' -- https://documentation.dataspace.copernicus.eu/APIs/SentinelHub/Data/DEM/resources/license/License-COPDEM-30.pdf); free of charge, reproduction/distribution/public-communication/adaptation all granted, commercial use permitted; required notice: "produced using Copernicus WorldDEM-30 © DLR e.V. 2010-2014 and © Airbus Defence and Space GmbH 2014-2018 provided under COPERNICUS by the European Union and ESA; all rights reserved." Tiles served by Mapterhorn (© Mapterhorn, https://mapterhorn.com/attribution) -- both notices required. · 2010-12-12부터 2015-01-07까지
고도, 범위
7.4 m — Hua Mak 면/동 내
출처: Mapterhorn terrain tiles (Copernicus DEM GLO-30 / WorldDEM-30, terrarium encoding, via tiles.mapterhorn.com) · 라이선스: Copernicus WorldDEM-30 Licence (COP-DEM-GLO-30-F, 'Global 30m Full, Free & Open' -- https://documentation.dataspace.copernicus.eu/APIs/SentinelHub/Data/DEM/resources/license/License-COPDEM-30.pdf); free of charge, reproduction/distribution/public-communication/adaptation all granted, commercial use permitted; required notice: "produced using Copernicus WorldDEM-30 © DLR e.V. 2010-2014 and © Airbus Defence and Space GmbH 2014-2018 provided under COPERNICUS by the European Union and ESA; all rights reserved." Tiles served by Mapterhorn (© Mapterhorn, https://mapterhorn.com/attribution) -- both notices required. · 2010-12-12부터 2015-01-07까지
10일 단위 강수 부족 비율 (최근 10년)
20.6% — Bang Kapi 군/구 내
출처: Climate Hazards Center UC Santa Barbara & WFP -- Thailand: Rainfall Indicators at Subnational Level (HDX) · 라이선스: CC BY (Creative Commons Attribution International) · 2016-01-01부터 2025-12-31까지
최근 10년간 최악의 3개월 강수 부족
26.3% — Bang Kapi 군/구 내
출처: Climate Hazards Center UC Santa Barbara & WFP -- Thailand: Rainfall Indicators at Subnational Level (HDX) · 라이선스: CC BY (Creative Commons Attribution International) · 2016-01-01부터 2025-12-31까지
PM2.5 연평균 (저가 센서)
25 µg/m³ — Bangkok 주 내
출처: OpenAQ — Soi Rimthang Rotfai 3-2662388 (low-cost) · 라이선스: CC BY 4.0 (AirGradient via OpenAQ) · 2025-01-01부터 2026-01-01까지
PM2.5 연평균
21.4 µg/m³ — Bangkok 주 내
출처: OpenAQ — Millennium Residence-2151387 (reference) · 라이선스: CC BY 4.0 (AirGradient via OpenAQ) · 2025-01-01부터 2026-01-01까지
최근 3개월 강수량 대비 평년 비율
106.4% — Bang Kapi 군/구 내
출처: Climate Hazards Center UC Santa Barbara & WFP -- Thailand: Rainfall Indicators at Subnational Level (HDX) · 라이선스: CC BY (Creative Commons Attribution International) · 2026-07-01부터 2026-09-21까지
이 지역에 대해 더 알아보기

선별 분석 자료는 안전 보증, 미래 위험 예측 또는 현장 조사가 아닙니다.

매물 리뷰

아직 리뷰가 없습니다. 첫 리뷰를 남겨보세요.

리뷰

리뷰 작성

로그인이 필요합니다. 프로젝트당 리뷰는 1개만 작성할 수 있습니다.

리뷰를 작성하려면 로그인하세요.

주변 프로젝트
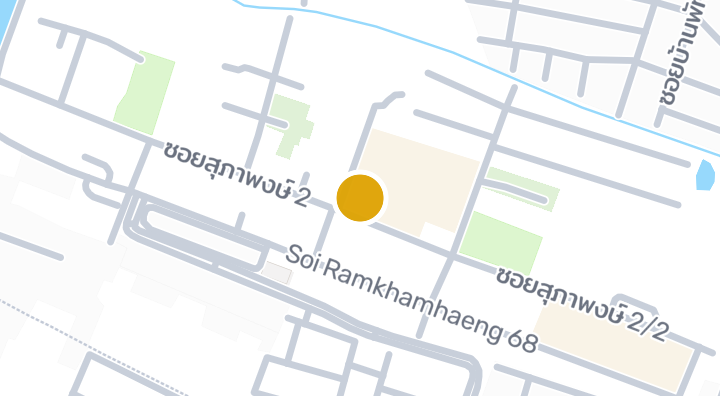
Bodin Condominium

Bodin Condominium

콘도미니엄

College Condo Abac

College Condo Abac

콘도미니엄

Bangkapi Sweet Home

Bangkapi Sweet Home

콘도미니엄

Chuan Chuen Sukhaphiban 3 Condominium in Hua Mak, Bang Kapi,

Chuan Chuen Sukhaphiban 3 Condominium in Hua Mak, Bang Kapi,

콘도미니엄
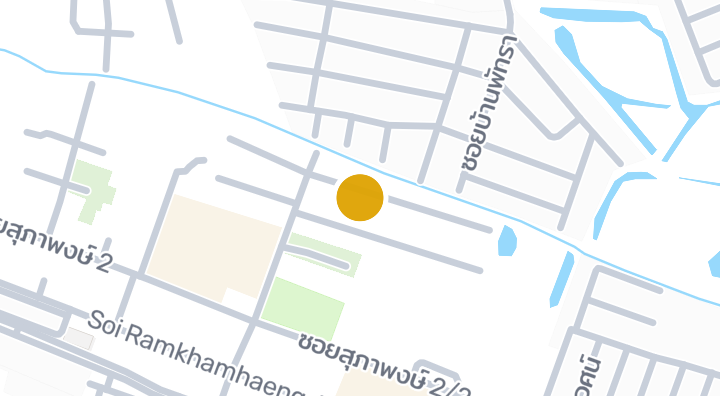
5 Karat

5 Karat

콘도미니엄

Patra Ramkhamhaeng 76

Patra Ramkhamhaeng 76

콘도미니엄

Casa City Ramkamheang Condominium in Hua Mak, Bang Kapi,

Casa City Ramkamheang Condominium in Hua Mak, Bang Kapi,

콘도미니엄
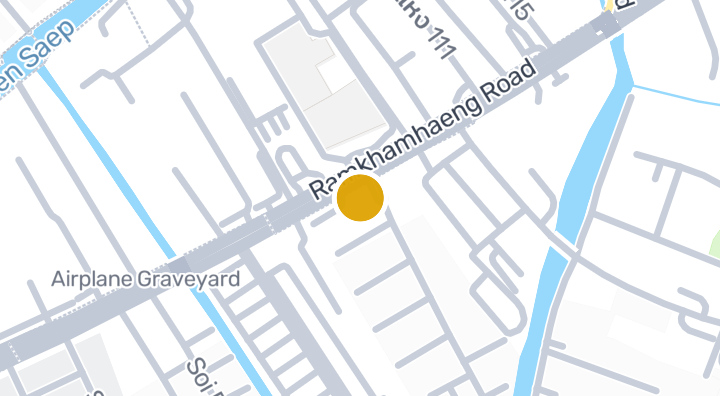
Pakpirom Ramkhamhaeng 64/3

Pakpirom Ramkhamhaeng 64/3

콘도미니엄

D Condo Ramkhamhaeng 64

D Condo Ramkhamhaeng 64

콘도미니엄

Phun Sin Condotown – Condominium in Hua Mak, Bang Kapi, Bang

Phun Sin Condotown – Condominium in Hua Mak, Bang Kapi, Bang

콘도미니엄
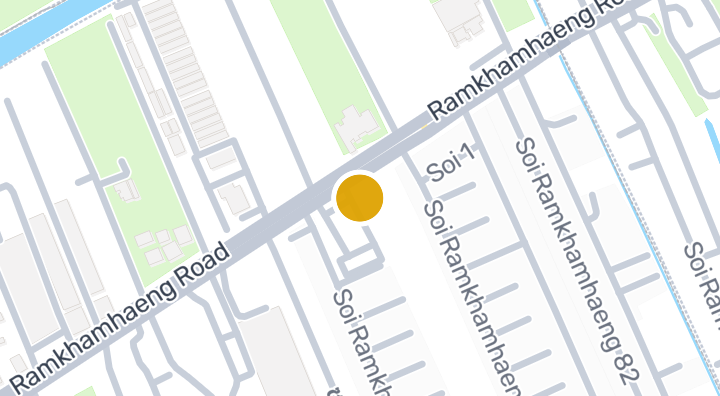
Pricha Lam Phet Village - Condominium in Hua Mak, Bang Kapi,

Pricha Lam Phet Village - Condominium in Hua Mak, Bang Kapi,

콘도미니엄
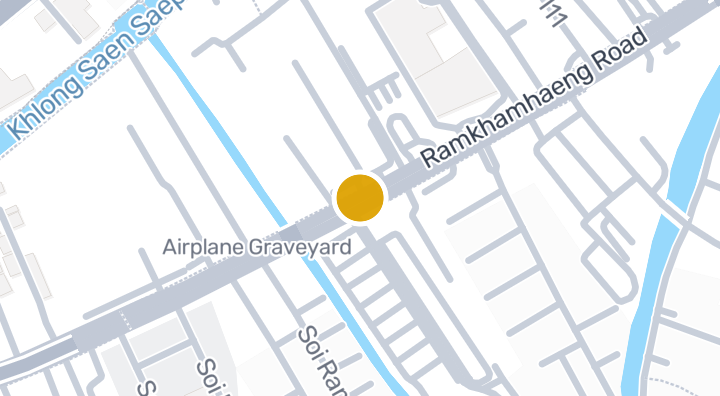
Assagarn Place Ramkhamhaeng - Condominium in Hua Mak, Bang K

Assagarn Place Ramkhamhaeng - Condominium in Hua Mak, Bang K

콘도미니엄

Sin Setthe Residence Town에 새 유닛이 나오면 알려드립니다.

입주 가능 콘도 보기
Sin Setthe Residence Town 내

더 둘러보기

  • 매물 둘러보기

    BaanMe — 매물 등록, 부동산 인사이트, 시장 정보를 위한 신뢰할 수 있는 플랫폼입니다.

  • 태국 77개 주 전체 탐색

    인터랙티브 지도에서 77개 주부터 928개 군과 7,425개 하위 지역까지 이동하며 현지 주택, 가격, 프로젝트와 지역 가이드를 비교하세요.

  • 교통, 학교 및 랜드마크 인근 주택

    일상에 중요한 장소를 선택한 뒤 근처의 최신 임대 및 매매 주택을 비교하세요. 아래 모든 장소의 검색 범위에는 실제 등록 매물이 있습니다.

  • 태국 부동산 시장 리포트

    태국 내 모든 활성 매물의 평균 호가(태국 바트 기준)입니다.