Rent a Home

Condos for Rent

Houses for Rent

Villas for Rent

Apartments for Rent

Buy a Home

Condos for Sale

Houses for Sale

Villas for Sale

Land for Sale

Explore

Areas

Use the interactive map to move from 77 provinces into 928 districts and 7,425 subdistricts, then compare local homes, prices, projects, and neighborhood guides.

Browse Projects

Search condos, housing estates, and developments with active listings

Homes near transit, schools and landmarks

Choose a place that matters to your daily life, then compare live rentals and homes for sale nearby. Every place below has active inventory in its search area.

Owner-approved opportunities

Explore properties whose owners have confirmed a price and are open to a conversation, including owners with no hurry to sell.

Find an agent near you

Browse verified real estate agents and agencies by province, with active listings and reviews.

Resources

Guides & insights

Thailand Property Market Report

The provinces with the most active listings on the network. Click a province for its full market report.

Best Of Guides

Curated picks for the best areas to buy, rent, and live in Thailand

Visa Opportunities

Visa types, extensions, and applications for Thailand

Thailand property law

Plain-language guides to Thai property law, verified against official sources — for foreign buyers, Thai buyers and renters.

Thailand Flood History Map

Free tool: check whether an address, soi, or condo project in Thailand has flooded before, using historical satellite (SAR) flood observations.

Property news

The latest visa, tax and property-law updates for Thailand, verified against official sources.

All Articles

Tips, market insights, and property guides

Tools

Thailand Mortgage Calculator

Estimate a monthly home-loan payment from the property price, down payment, annual interest rate, and loan term you enter.

Transfer Fees Calculator

Estimate taxes and fees for property transfers in Thailand

Unit Conversions

Convert between Thai and international land units

  • Condos for Rent
  • Houses for Rent
  • Villas for Rent
  • Apartments for Rent
  • Condos for Sale
  • Houses for Sale
  • Villas for Sale
  • Land for Sale
  • Areas
  • Browse Projects
  • Homes near transit, schools and landmarks
  • Owner-approved opportunities
  • Find an agent near you
  • Thailand Property Market Report
  • Best Of Guides
  • Visa Opportunities
  • Thailand property law
  • Thailand Flood History Map
  • Property news
  • All Articles
  • Thailand Mortgage Calculator
  • Transfer Fees Calculator
  • Unit Conversions

Why BaanMe?

ID-Verified Agents

Every BaanMe agent is verified against a Thai government ID before they can publish a single listing — so you always know exactly who you are dealing with, and bad actors get permanently banned.

Secure In-App Chat (Coming Soon)

We are developing in-app messaging. Until it launches, contact options depend on the agent and listing.

Deposit Protection (Coming Soon)

Soon, BaanMe will hold your security deposit in escrow and review every claim ourselves — so unfair deductions and disappearing landlords become a thing of the past.

Contract Support

Ask your agent which contract languages and terms are available before signing.

Environmental Impact

We care about your, our, and everyone's environment. Which is why we have committed ourselves to re-foresting the rainforest in Pai, Thailand, with the help of Conserve Natural Forests, a local NGO committed to forest restoration in and around Pai.

Regions

  • Homes in Bangkok
  • Homes in Chiang Mai
  • Homes in Samut Prakan
  • Homes in Phetchabun
  • Homes in Lamphun
  • Homes in Nonthaburi
  • Homes in Chiang Rai
  • Homes in Chon Buri

Browse Properties

  • Bangkok Condos for Rent
  • Bangkok Apartments for Rent
  • Chiang Mai Houses for Rent
  • Bangkok Offices for Rent
  • Bangkok Warehouses for Rent
  • Koh Samui Houses for Rent
  • All Properties →

FAQ

  • Thailand Property Market Trends 2026: A Selective Recovery
  • More →

Best Of Guides

  • Best Areas to Buy a Condo in Bangkok
  • Best Neighborhoods for Expats in Thailand
  • Best Areas to Rent in Chiang Mai
  • Best Places to Buy a House in Phuket
  • Best Neighborhoods for Families in Bangkok
  • All Guides →

BaanMe

  • About BaanMe
  • Press Inquiries
  • Brand Assets
  • Privacy Policy
  • Terms & Conditions
  • Map Attribution
  • Help
  • Add BaanMe as a preferred source on Google
  • Delete Account

© Niklas Benjamin Muegge, 2026

  1. Home
  2. …
    1. Chiang Mai
    2. San Kamphaeng
  3. Chiang Mai
  4. San Kamphaeng
  5. Siwalai San kamphaeng
Siwalai San kamphaeng
OverviewLocationReviewAvailable CondosSimilar ProjectsNearby Projects

Siwalai San kamphaeng

Buy

฿3.8M – ฿8.5M

Rent

฿20K – ฿57.6K

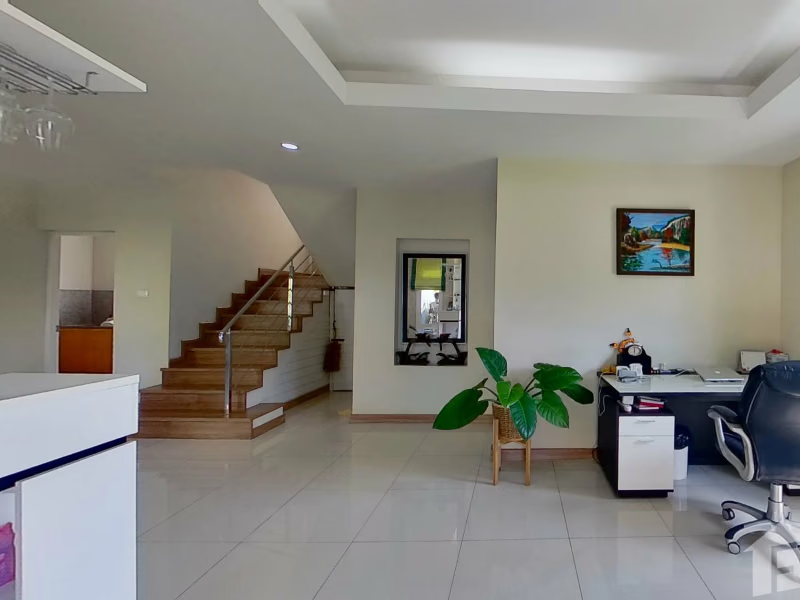
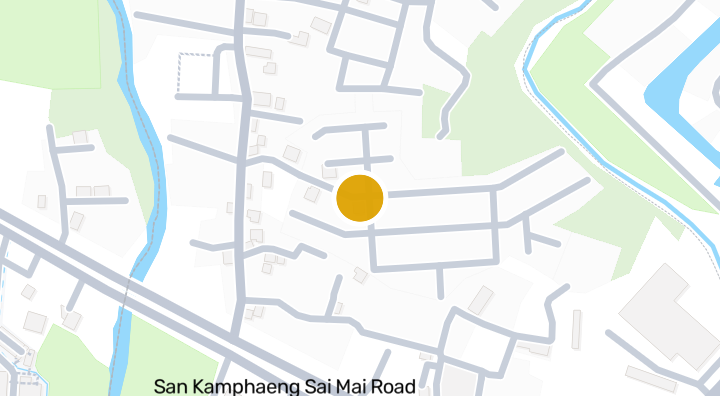
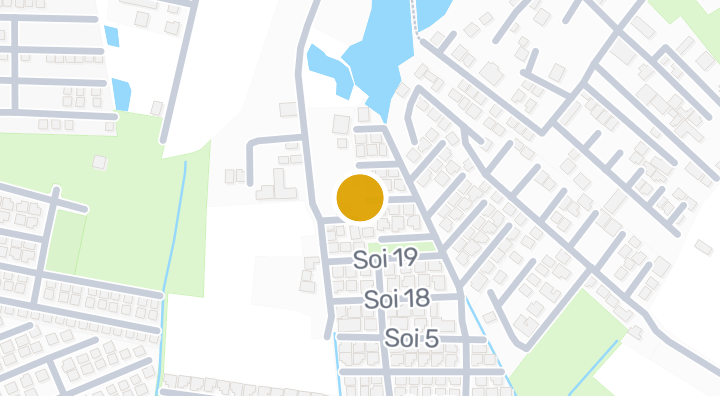
Siwalai San kamphaeng is a house project located in Ton Pao, San Kamphaeng, Chiang Mai. The development is situated in an area known for local attractions, including the Sa Paper & Umbrella Handicraft Centre, which is about 4 minutes away. Chiang Mai Airsport Airfield is roughly 23 minutes from the project, while Pang Pao Beach can be reached in about 47 minutes. Developer and completion details have not been disclosed.

See Available Condos
In Siwalai San kamphaeng

Location

San Kamphaeng, Chiang Mai

23 min

to Chiang Mai Airsport Airfield

commute

4 min

San Kamphaeng, Chiang Mai

Check your commute

Save places and compare travel times from this home.

Neighborhood
San Kamphaeng

San Kamphaeng

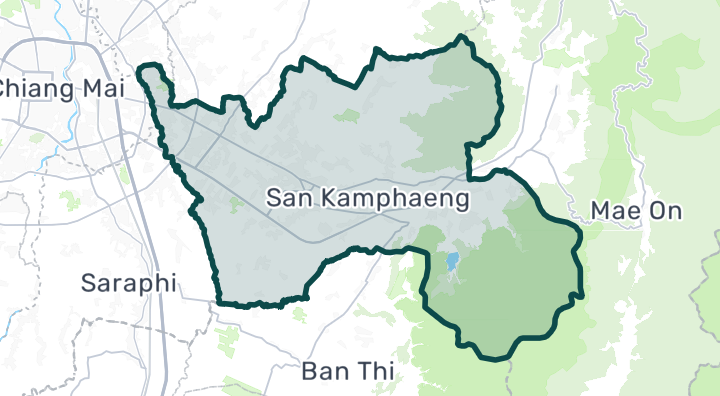
San Kamphaeng stretches east from Chiang Mai city toward the San Kamphaeng Hot Springs and the Borsang umbrella-making village. The district is known for traditional crafts — silk weaving, paper umbrellas, celadon pottery — and an authentically rural Northern Thai atmosphere. It's one of the most affordable areas near Chiang Mai, making it attractive for buyers wanting large plots of land. Rural Thai lifestyle with rice paddies, temples, and local markets San Kamphaeng Hot Springs — natural mineral springs and spa facilities Borsang village — traditional umbrella painting, popular tourist attraction 20-30 minutes to Chiang Mai city center via Route 1006 Among the most affordable near Chiang Mai. Houses: 2–5 million THB. Land: 1–3 million THB per rai. Rental houses: 8,000–20,000 THB/month. Great value for those comfortable with a more rural setting.

Explore San Kamphaeng

Location risk & context

river floodingHigh(estimated)
flash floodingNot enough data yet(basis not available)
droughtLow(based on the surrounding area)
poor air qualityMedium(observed)
fire riskNot enough data yet(basis not available)
extreme heatNot enough data yet(basis not available)
River flooding
Regional drainage-height 10th percentile: -1.151145538315177 m. This describes the area, not this parcel.
Evidence scope: Area context · Confidence: Low
Flash flooding
No usable evidence is available.
Evidence scope: Insufficient evidence
Drought
Rainfall was below the local normal in 9.444444444444445% of analysed 10-day periods. Regional screening uses project-defined thresholds.
Evidence scope: Area context · Confidence: Medium
Air quality
Annual mean PM2.5: 20.57780246767044 µg/m³, source: OpenAQ. This is not a current air-quality reading.
Evidence scope: Area context · Confidence: Medium
Fire
No usable evidence is available.
Evidence scope: Insufficient evidence
Heat
No usable evidence is available.
Evidence scope: Insufficient evidence

Flood

River flood

No satellite flood observation covers this location yet

River hazard is scored only against a single 2024 satellite-observed flood event covering four northern Thailand provinces (Chiang Mai, Chiang Rai, Lamphun, Phayao). "Unknown" outside that area means no observation exists yet — it does not mean the area is safe.

Flash flood

Not yet assessed

Confidence: low

  • Slope: 0.7%

Flash-flood terrain data is derived from OpenStreetMap waterway data. See OpenStreetMap attribution

Area context

Government construction cost estimate, maximum
13,000 THB/m² — In Chiang Mai province
Source: Treasury Department (กรมธนารักษ์) construction cost appraisal · License: Open Data Common (Treasury Department building valuation catalogue) · 2024-08-15 to 2027-12-31
Government construction cost estimate, typical
7,900 THB/m² — In Chiang Mai province
Source: Treasury Department (กรมธนารักษ์) construction cost appraisal · License: Open Data Common (Treasury Department building valuation catalogue) · 2024-08-15 to 2027-12-31
Government construction cost estimate, minimum
400 THB/m² — In Chiang Mai province
Source: Treasury Department (กรมธนารักษ์) construction cost appraisal · License: Open Data Common (Treasury Department building valuation catalogue) · 2024-08-15 to 2027-12-31
Treasury land appraisal (municipality), maximum — assessed value, not market price
14,500 THB/sq_wah — In Ton Pao subdistrict
Source: Treasury Department (กรมธนารักษ์) land valuation (ราคาประเมินที่ดิน) - attach_all_20240805.csv — เทศบาลเมืองต้นเปา (municipal area) · License: Open Data Common · 2024-08-14 to 2024-08-14
Treasury land appraisal (municipality), typical — assessed value, not market price
4,250 THB/sq_wah — In Ton Pao subdistrict
Source: Treasury Department (กรมธนารักษ์) land valuation (ราคาประเมินที่ดิน) - attach_all_20240805.csv — เทศบาลเมืองต้นเปา (municipal area) · License: Open Data Common · 2024-08-14 to 2024-08-14
Treasury land appraisal (municipality), minimum — assessed value, not market price
1,000 THB/sq_wah — In Ton Pao subdistrict
Source: Treasury Department (กรมธนารักษ์) land valuation (ราคาประเมินที่ดิน) - attach_all_20240805.csv — เทศบาลเมืองต้นเปา (municipal area) · License: Open Data Common · 2024-08-14 to 2024-08-14
Treasury land appraisal (subdistrict), maximum — assessed value, not market price
12,000 THB/sq_wah — In San Kamphaeng district
Source: Treasury Department (กรมธนารักษ์) land valuation (ราคาประเมินที่ดิน) - attach_all_20240805.csv · License: Open Data Common · 2024-08-14 to 2024-08-14
Treasury land appraisal (subdistrict), typical — assessed value, not market price
1,500 THB/sq_wah — In San Kamphaeng district
Source: Treasury Department (กรมธนารักษ์) land valuation (ราคาประเมินที่ดิน) - attach_all_20240805.csv · License: Open Data Common · 2024-08-14 to 2024-08-14
Treasury land appraisal (subdistrict), minimum — assessed value, not market price
500 THB/sq_wah — In San Kamphaeng district
Source: Treasury Department (กรมธนารักษ์) land valuation (ราคาประเมินที่ดิน) - attach_all_20240805.csv · License: Open Data Common · 2024-08-14 to 2024-08-14
Driest month
February — In Chiang Mai province
Source: Open-Meteo (ERA5 reanalysis, via archive-api.open-meteo.com) · License: CC BY 4.0 (Attribution 4.0 International) -- https://open-meteo.com/en/licence · 1991-01-01 to 2020-12-31
Climate rainfall annual total mean mm
2,060.3 mm — In Chiang Mai province
Source: Open-Meteo (ERA5 reanalysis, via archive-api.open-meteo.com) · License: CC BY 4.0 (Attribution 4.0 International) -- https://open-meteo.com/en/licence · 1991-01-01 to 2020-12-31
Wettest month
August — In Chiang Mai province
Source: Open-Meteo (ERA5 reanalysis, via archive-api.open-meteo.com) · License: CC BY 4.0 (Attribution 4.0 International) -- https://open-meteo.com/en/licence · 1991-01-01 to 2020-12-31
Height above nearest drainage (typical)
-0 m — In Ton Pao subdistrict
Source: Terrain-derived flash-flood indicators (HAND + slope + OSM drainage proximity; NOT a forecast or probability, not calibrated against observed events) from Copernicus DEM GLO-30 (via Mapterhorn terrain tiles) and OpenStreetMap waterway data. The banded metric flags whether the region CONTAINS terrain susceptible to flash flooding somewhere within it -- not the susceptibility of the region as a whole, and not of any individual property. · License: Copernicus WorldDEM-30 Licence, commercial use permitted (see ./region-elevation.ts's ELEVATION_SOURCE_LICENSE for the full citation) combined with OpenStreetMap contributors: ODbL 1.0 (https://www.openstreetmap.org/copyright) · 2010-12-12 to 2015-01-07
Height above nearest drainage (lowest 10%)
-1.2 m — In Ton Pao subdistrict
Source: Terrain-derived flash-flood indicators (HAND + slope + OSM drainage proximity; NOT a forecast or probability, not calibrated against observed events) from Copernicus DEM GLO-30 (via Mapterhorn terrain tiles) and OpenStreetMap waterway data. The banded metric flags whether the region CONTAINS terrain susceptible to flash flooding somewhere within it -- not the susceptibility of the region as a whole, and not of any individual property. · License: Copernicus WorldDEM-30 Licence, commercial use permitted (see ./region-elevation.ts's ELEVATION_SOURCE_LICENSE for the full citation) combined with OpenStreetMap contributors: ODbL 1.0 (https://www.openstreetmap.org/copyright) · 2010-12-12 to 2015-01-07
Terrain slope (typical)
0.2% — In Ton Pao subdistrict
Source: Terrain-derived flash-flood indicators (HAND + slope + OSM drainage proximity; NOT a forecast or probability, not calibrated against observed events) from Copernicus DEM GLO-30 (via Mapterhorn terrain tiles) and OpenStreetMap waterway data. The banded metric flags whether the region CONTAINS terrain susceptible to flash flooding somewhere within it -- not the susceptibility of the region as a whole, and not of any individual property. · License: Copernicus WorldDEM-30 Licence, commercial use permitted (see ./region-elevation.ts's ELEVATION_SOURCE_LICENSE for the full citation) combined with OpenStreetMap contributors: ODbL 1.0 (https://www.openstreetmap.org/copyright) · 2010-12-12 to 2015-01-07
Terrain slope (steepest 10%)
0.3% — In Ton Pao subdistrict
Source: Terrain-derived flash-flood indicators (HAND + slope + OSM drainage proximity; NOT a forecast or probability, not calibrated against observed events) from Copernicus DEM GLO-30 (via Mapterhorn terrain tiles) and OpenStreetMap waterway data. The banded metric flags whether the region CONTAINS terrain susceptible to flash flooding somewhere within it -- not the susceptibility of the region as a whole, and not of any individual property. · License: Copernicus WorldDEM-30 Licence, commercial use permitted (see ./region-elevation.ts's ELEVATION_SOURCE_LICENSE for the full citation) combined with OpenStreetMap contributors: ODbL 1.0 (https://www.openstreetmap.org/copyright) · 2010-12-12 to 2015-01-07
Distance to nearest watercourse (typical)
156.3 m — In Ton Pao subdistrict
Source: Terrain-derived flash-flood indicators (HAND + slope + OSM drainage proximity; NOT a forecast or probability, not calibrated against observed events) from Copernicus DEM GLO-30 (via Mapterhorn terrain tiles) and OpenStreetMap waterway data. The banded metric flags whether the region CONTAINS terrain susceptible to flash flooding somewhere within it -- not the susceptibility of the region as a whole, and not of any individual property. · License: Copernicus WorldDEM-30 Licence, commercial use permitted (see ./region-elevation.ts's ELEVATION_SOURCE_LICENSE for the full citation) combined with OpenStreetMap contributors: ODbL 1.0 (https://www.openstreetmap.org/copyright) · 2010-12-12 to 2015-01-07
Distance to nearest watercourse (closest 10%)
46.1 m — In Ton Pao subdistrict
Source: Terrain-derived flash-flood indicators (HAND + slope + OSM drainage proximity; NOT a forecast or probability, not calibrated against observed events) from Copernicus DEM GLO-30 (via Mapterhorn terrain tiles) and OpenStreetMap waterway data. The banded metric flags whether the region CONTAINS terrain susceptible to flash flooding somewhere within it -- not the susceptibility of the region as a whole, and not of any individual property. · License: Copernicus WorldDEM-30 Licence, commercial use permitted (see ./region-elevation.ts's ELEVATION_SOURCE_LICENSE for the full citation) combined with OpenStreetMap contributors: ODbL 1.0 (https://www.openstreetmap.org/copyright) · 2010-12-12 to 2015-01-07
Flash-flood terrain susceptibility
moderate — In Ton Pao subdistrict
Source: Terrain-derived flash-flood indicators (HAND + slope + OSM drainage proximity; NOT a forecast or probability, not calibrated against observed events) from Copernicus DEM GLO-30 (via Mapterhorn terrain tiles) and OpenStreetMap waterway data. The banded metric flags whether the region CONTAINS terrain susceptible to flash flooding somewhere within it -- not the susceptibility of the region as a whole, and not of any individual property. · License: Copernicus WorldDEM-30 Licence, commercial use permitted (see ./region-elevation.ts's ELEVATION_SOURCE_LICENSE for the full citation) combined with OpenStreetMap contributors: ODbL 1.0 (https://www.openstreetmap.org/copyright) · 2010-12-12 to 2015-01-07
Elevation, maximum
306.1 m — In Ton Pao subdistrict
Source: Mapterhorn terrain tiles (Copernicus DEM GLO-30 / WorldDEM-30, terrarium encoding, via tiles.mapterhorn.com) · License: Copernicus WorldDEM-30 Licence (COP-DEM-GLO-30-F, 'Global 30m Full, Free & Open' -- https://documentation.dataspace.copernicus.eu/APIs/SentinelHub/Data/DEM/resources/license/License-COPDEM-30.pdf); free of charge, reproduction/distribution/public-communication/adaptation all granted, commercial use permitted; required notice: "produced using Copernicus WorldDEM-30 © DLR e.V. 2010-2014 and © Airbus Defence and Space GmbH 2014-2018 provided under COPERNICUS by the European Union and ESA; all rights reserved." Tiles served by Mapterhorn (© Mapterhorn, https://mapterhorn.com/attribution) -- both notices required. · 2010-12-12 to 2015-01-07
Elevation, typical
302.9 m — In Ton Pao subdistrict
Source: Mapterhorn terrain tiles (Copernicus DEM GLO-30 / WorldDEM-30, terrarium encoding, via tiles.mapterhorn.com) · License: Copernicus WorldDEM-30 Licence (COP-DEM-GLO-30-F, 'Global 30m Full, Free & Open' -- https://documentation.dataspace.copernicus.eu/APIs/SentinelHub/Data/DEM/resources/license/License-COPDEM-30.pdf); free of charge, reproduction/distribution/public-communication/adaptation all granted, commercial use permitted; required notice: "produced using Copernicus WorldDEM-30 © DLR e.V. 2010-2014 and © Airbus Defence and Space GmbH 2014-2018 provided under COPERNICUS by the European Union and ESA; all rights reserved." Tiles served by Mapterhorn (© Mapterhorn, https://mapterhorn.com/attribution) -- both notices required. · 2010-12-12 to 2015-01-07
Elevation, minimum
298.5 m — In Ton Pao subdistrict
Source: Mapterhorn terrain tiles (Copernicus DEM GLO-30 / WorldDEM-30, terrarium encoding, via tiles.mapterhorn.com) · License: Copernicus WorldDEM-30 Licence (COP-DEM-GLO-30-F, 'Global 30m Full, Free & Open' -- https://documentation.dataspace.copernicus.eu/APIs/SentinelHub/Data/DEM/resources/license/License-COPDEM-30.pdf); free of charge, reproduction/distribution/public-communication/adaptation all granted, commercial use permitted; required notice: "produced using Copernicus WorldDEM-30 © DLR e.V. 2010-2014 and © Airbus Defence and Space GmbH 2014-2018 provided under COPERNICUS by the European Union and ESA; all rights reserved." Tiles served by Mapterhorn (© Mapterhorn, https://mapterhorn.com/attribution) -- both notices required. · 2010-12-12 to 2015-01-07
Elevation, range
7.6 m — In Ton Pao subdistrict
Source: Mapterhorn terrain tiles (Copernicus DEM GLO-30 / WorldDEM-30, terrarium encoding, via tiles.mapterhorn.com) · License: Copernicus WorldDEM-30 Licence (COP-DEM-GLO-30-F, 'Global 30m Full, Free & Open' -- https://documentation.dataspace.copernicus.eu/APIs/SentinelHub/Data/DEM/resources/license/License-COPDEM-30.pdf); free of charge, reproduction/distribution/public-communication/adaptation all granted, commercial use permitted; required notice: "produced using Copernicus WorldDEM-30 © DLR e.V. 2010-2014 and © Airbus Defence and Space GmbH 2014-2018 provided under COPERNICUS by the European Union and ESA; all rights reserved." Tiles served by Mapterhorn (© Mapterhorn, https://mapterhorn.com/attribution) -- both notices required. · 2010-12-12 to 2015-01-07
Share of 10-day periods with rainfall deficit (10-year)
9.4% — In Chiang Mai province
Source: Climate Hazards Center UC Santa Barbara & WFP -- Thailand: Rainfall Indicators at Subnational Level (HDX) · License: CC BY (Creative Commons Attribution International) · 2016-01-01 to 2025-12-31
Worst 3-month rainfall deficit (10-year)
37.8% — In Chiang Mai province
Source: Climate Hazards Center UC Santa Barbara & WFP -- Thailand: Rainfall Indicators at Subnational Level (HDX) · License: CC BY (Creative Commons Attribution International) · 2016-01-01 to 2025-12-31
Share of area analysed for flooding, 2024 event
100% — In Ton Pao subdistrict
Source: UNOSAT FL20240912THA -- Satellite detected water extents from 5 to 10 October 2024 over Chiang Mai and Lamphun Provinces (OBSERVED flood extent for ONE 2024 satellite pass -- not a general or future flood-risk indicator) · License: CC BY-SA (UNOSAT / United Nations Satellite Centre) · 2024-10-05 to 2024-10-10
Observed flooded area, 2024 event
0 km2 — In Ton Pao subdistrict
Source: UNOSAT FL20240912THA -- Satellite detected water extents from 5 to 10 October 2024 over Chiang Mai and Lamphun Provinces (OBSERVED flood extent for ONE 2024 satellite pass -- not a general or future flood-risk indicator) · License: CC BY-SA (UNOSAT / United Nations Satellite Centre) · 2024-10-05 to 2024-10-10
Share of area flooded, 2024 event
0% — In Ton Pao subdistrict
Source: UNOSAT FL20240912THA -- Satellite detected water extents from 5 to 10 October 2024 over Chiang Mai and Lamphun Provinces (OBSERVED flood extent for ONE 2024 satellite pass -- not a general or future flood-risk indicator) · License: CC BY-SA (UNOSAT / United Nations Satellite Centre) · 2024-10-05 to 2024-10-10
Flood exposure, 2024 event
none observed — In Ton Pao subdistrict
Source: UNOSAT FL20240912THA -- Satellite detected water extents from 5 to 10 October 2024 over Chiang Mai and Lamphun Provinces (OBSERVED flood extent for ONE 2024 satellite pass -- not a general or future flood-risk indicator) · License: CC BY-SA (UNOSAT / United Nations Satellite Centre) · 2024-10-05 to 2024-10-10
PM2.5, annual average (low-cost sensor)
27.8 µg/m³ — In Chiang Mai province
Source: OpenAQ — ไดมอนด์.-2545166 (low-cost) · License: CC BY 4.0 (AirGradient via OpenAQ) · 2025-01-01 to 2026-01-01
PM2.5, annual average
20.6 µg/m³ — In Chiang Mai province
Source: OpenAQ — NARIT ASTROPARK (Parking)-1224519 (reference) · License: CC BY 4.0 (AirGradient via OpenAQ) · 2025-01-01 to 2026-01-01
Recent 3-month rainfall vs. normal
102% — In Chiang Mai province
Source: Climate Hazards Center UC Santa Barbara & WFP -- Thailand: Rainfall Indicators at Subnational Level (HDX) · License: CC BY (Creative Commons Attribution International) · 2026-07-01 to 2026-09-21
See more about this area

Screening evidence is not a safety guarantee, a future risk forecast or a site inspection.

Market Stats

From this project's active listings

Not enough listings yet

Sale price / sqm

Not enough listings yet

Rent price / sqm

Not enough listings yet

Gross rental yield

Not enough listings yet

Rent-to-sale spread

Unit Mix
Unit Mix
BedroomsActive listingsSale price / sqmRent price / sqm
3 bedrooms2Not enough listings yetNot enough listings yet
4 bedrooms3Not enough listings yetNot enough listings yet
5 bedrooms1Not enough listings yetNot enough listings yet

Property Reviews

No reviews yet — be the first to leave one.

Reviews

Leave a review

Sign in required. One review per project.

Sign in to leave a review.

Available for Rent

25,000 THB/mo

339 m²64 wah²+12 mo.
Siwalai San kamphaeng · San Kamphaeng

36,000 THB/mo

44200 m²60 wah²+12 mo.
Siwalai San kamphaeng · San Kamphaeng

36,000 THB/mo

44200 m²60 wah²+12 mo.
Siwalai San kamphaeng · San Kamphaeng

20,000 THB/mo

43100 m²80 wah²+12 mo.
Siwalai San kamphaeng · San Kamphaeng

Available for Sale

3,790,000 THB

33174 m²60 wah²
Siwalai San kamphaeng · San Kamphaeng

36,000 THB/mo

44200 m²60 wah²+12 mo.
Siwalai San kamphaeng · San Kamphaeng

36,000 THB/mo

44200 m²60 wah²+12 mo.
Siwalai San kamphaeng · San Kamphaeng

7,500,000 THB

52263 m²50 wah²
Siwalai San kamphaeng · San Kamphaeng

Nearby Projects

Sivalai Village 4 Houses in Ton Pao, San Kamphaeng, Chiang |

Sivalai Village 4 Houses in Ton Pao, San Kamphaeng, Chiang |

Housing Estate
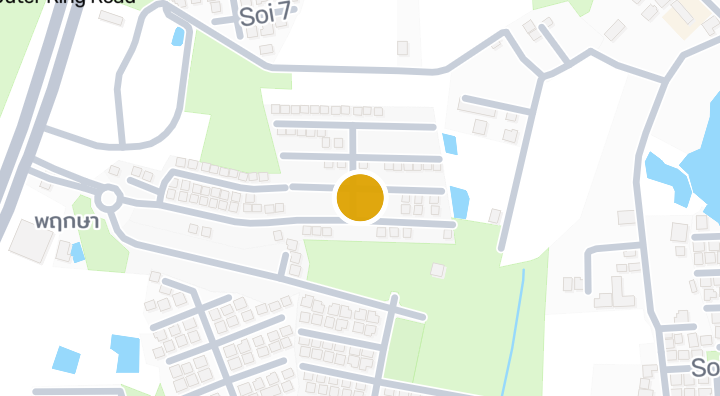
Passorn PRIDE

Passorn PRIDE

Housing Estate

Passorn Pride Village - House Project in Ton Pao, San Kampha

Passorn Pride Village - House Project in Ton Pao, San Kampha

Housing Estate
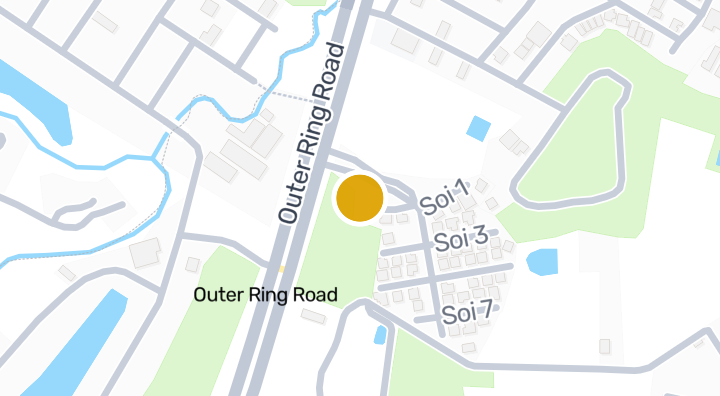
House & View 1

House & View 1

Housing Estate

The Esteem - House Project in Ton Pao, San Kamphaeng, Chiang

The Esteem - House Project in Ton Pao, San Kamphaeng, Chiang

Housing Estate
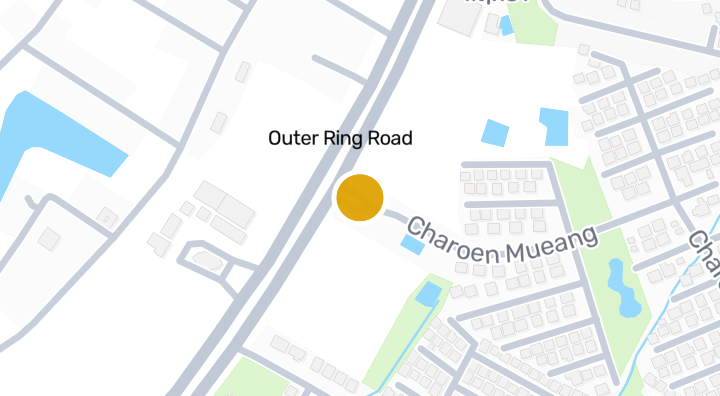
Vararom Charoenmuang Houses in San Kamphaeng, Chiang Mai

Vararom Charoenmuang Houses in San Kamphaeng, Chiang Mai

Housing Estate
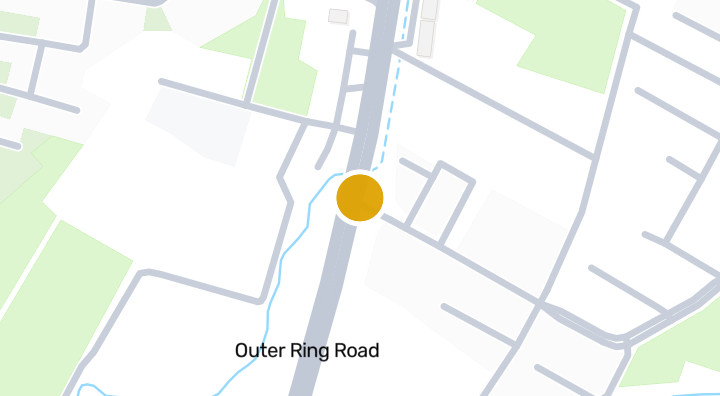
Baan Fah Luang

Baan Fah Luang

Housing Estate

Pimpichada - House Project in San Klang, San Kamphaeng, Ch

Pimpichada - House Project in San Klang, San Kamphaeng, Ch

Housing Estate
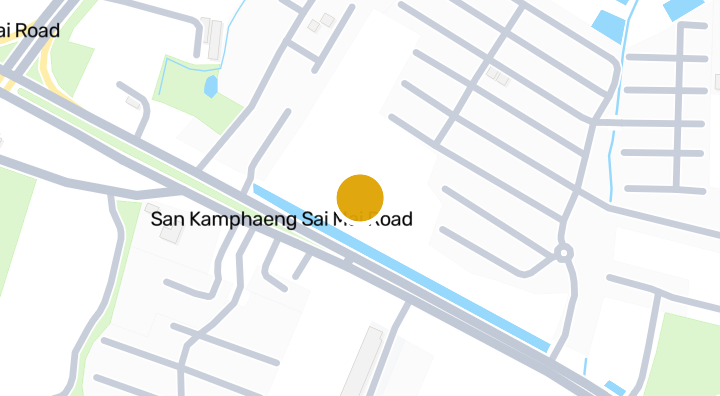
Serene Park - Houses in Ton Pao, San Kamphaeng, Chiang Mai

Serene Park - Houses in Ton Pao, San Kamphaeng, Chiang Mai

Housing Estate

Siriporn Don-Chan Houses in Ton Pao, San Kamphaeng, Chiang

Siriporn Don-Chan Houses in Ton Pao, San Kamphaeng, Chiang

Housing Estate
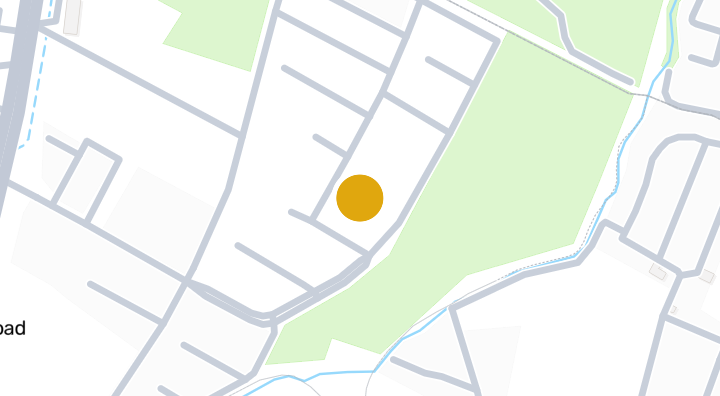
Fah Luang Village

Fah Luang Village

Housing Estate

Sirin Home 3

Sirin Home 3

Housing Estate

Get notified when new units become available in Siwalai San kamphaeng.

See Available Condos
In Siwalai San kamphaeng

Explore more

  • Browse Properties

    BaanMe — your trusted platform for property listings, real estate insights, and market intelligence.

  • Explore all 77 provinces of Thailand

    Use the interactive map to move from 77 provinces into 928 districts and 7,425 subdistricts, then compare local homes, prices, projects, and neighborhood guides.

  • Homes near transit, schools and landmarks

    Choose a place that matters to your daily life, then compare live rentals and homes for sale nearby. Every place below has active inventory in its search area.

  • Thailand Property Market Report

    Median asking prices across all active listings in Thailand, in Thai Baht.