Louer un logement

Condos à louer

Maisons à louer

Villas à louer

Appartements à louer

Acheter un logement

Condos à vendre

Maisons à vendre

Villas à vendre

Terrains à vendre

Explorer

Zones

Utilisez la carte interactive pour passer de 77 provinces à 928 districts et 7 425 sous-districts, puis comparez logements, prix, projets et guides locaux.

Parcourir les projets

Recherchez des copropriétés, lotissements et programmes immobiliers avec des annonces actives

Logements près des transports, écoles et sites d’intérêt

Choisissez un lieu important pour votre quotidien, puis comparez les locations et biens à vendre à proximité. Chaque lieu ci-dessous dispose d’annonces actives dans sa zone de recherche.

Opportunités approuvées par les propriétaires

Explorez les biens dont les propriétaires ont confirmé un prix et sont ouverts à une discussion, y compris ceux qui ne sont pas pressés de vendre.

Trouvez un agent près de chez vous

Parcourez des agents et agences immobilières vérifiés par province, avec leurs annonces actives et avis.

Ressources

Guides et analyses

Rapport sur le marché immobilier en Thaïlande

Les provinces comptant le plus d'annonces actives sur le réseau. Cliquez sur une province pour consulter son rapport de marché complet.

Meilleurs guides

Sélection des meilleures zones où acheter, louer et vivre en Thaïlande

Opportunités de visa

Types de visas, extensions et démarches en Thaïlande

Droit immobilier en Thaïlande

Des guides clairs du droit immobilier thaïlandais, vérifiés auprès de sources officielles — pour les acheteurs étrangers, les acheteurs thaïlandais et les locataires.

Carte de l'historique des inondations en Thaïlande

Outil gratuit : vérifiez si une adresse, un soi ou un projet de condo en Thaïlande a déjà été inondé, à partir d'observations satellitaires historiques (SAR) des inondations.

Actualités immobilières

Les dernières évolutions des visas, de la fiscalité et du droit immobilier en Thaïlande, vérifiées auprès de sources officielles.

Tous les articles

Conseils, analyses de marché et guides immobiliers

Outils

Calculateur de prêt immobilier en Thaïlande

Estimez la mensualité d'un prêt immobilier à partir du prix, de l'apport, du taux annuel et de la durée que vous saisissez.

Calculateur de frais de transfert

Estimez les taxes et frais liés aux transferts de propriété en Thaïlande

Conversion d'unités

Convertissez les unités de surface thaïlandaises et internationales

  • Condos à louer
  • Maisons à louer
  • Villas à louer
  • Appartements à louer
  • Condos à vendre
  • Maisons à vendre
  • Villas à vendre
  • Terrains à vendre
  • Zones
  • Parcourir les projets
  • Logements près des transports, écoles et sites d’intérêt
  • Opportunités approuvées par les propriétaires
  • Trouvez un agent près de chez vous
  • Rapport sur le marché immobilier en Thaïlande
  • Meilleurs guides
  • Opportunités de visa
  • Droit immobilier en Thaïlande
  • Carte de l'historique des inondations en Thaïlande
  • Actualités immobilières
  • Tous les articles
  • Calculateur de prêt immobilier en Thaïlande
  • Calculateur de frais de transfert
  • Conversion d'unités

Pourquoi BaanMe ?

Agents vérifiés par pièce d'identité

Chaque agent BaanMe est vérifié à l'aide d'une pièce d'identité officielle thaïlandaise avant de pouvoir publier la moindre annonce — vous savez donc toujours exactement à qui vous avez affaire, et les personnes malveillantes sont bannies définitivement.

Messagerie sécurisée (à venir)

Nous développons la messagerie intégrée. En attendant, les moyens de contact dépendent de l’agent et de l’annonce.

Protection de la caution (bientôt disponible)

Bientôt, BaanMe conservera votre caution en dépôt fiduciaire et examinera chaque réclamation nous-mêmes — pour que les retenues injustes et les propriétaires disparus appartiennent au passé.

Accompagnement contractuel

Avant de signer, demandez à votre agent quelles langues et conditions contractuelles sont disponibles.

Impact environnemental

Nous nous soucions de votre environnement, du nôtre et de celui de tous. C'est pourquoi nous nous sommes engagés à reboiser la forêt tropicale de Pai, en Thaïlande, avec l'aide de Conserve Natural Forests, une ONG locale dédiée à la restauration forestière à Pai et ses environs.

Régions

  • Logements à Bangkok
  • Logements à Chiang Mai
  • Logements à Samut Prakan
  • Logements à Phetchabun
  • Logements à Lamphun
  • Logements à Nonthaburi
  • Logements à Chiang Rai
  • Logements à Chon Buri

Parcourir les biens

  • Condos à louer à Bangkok
  • Appartements à louer à Bangkok
  • Maisons à louer à Chiang Mai
  • Bureaux à louer à Bangkok
  • Entrepôts à louer à Bangkok
  • Maisons à louer à Koh Samui
  • Tous les biens →

FAQ

  • Thailand Property Market Trends 2026: A Selective Recovery
  • Plus →

BaanMe

  • À propos de BaanMe
  • Demandes presse
  • Ressources de marque
  • Politique de confidentialité
  • Conditions générales
  • Crédits cartographiques
  • Aide
  • Ajouter BaanMe comme source préférée sur Google
  • Supprimer le compte

© Niklas Benjamin Muegge, 2026

  1. Accueil
  2. …
    1. Chiang Mai
    2. San Kamphaeng
  3. Chiang Mai
  4. San Kamphaeng
  5. Inizio
Inizio
AperçuÉquipementsFaits & ChiffresEmplacementPromoteurAvisCondos disponiblesProjets similairesProjets à proximité

Inizio

Acheter

฿3.5M – ฿8.5M

Location

฿24K – ฿56K

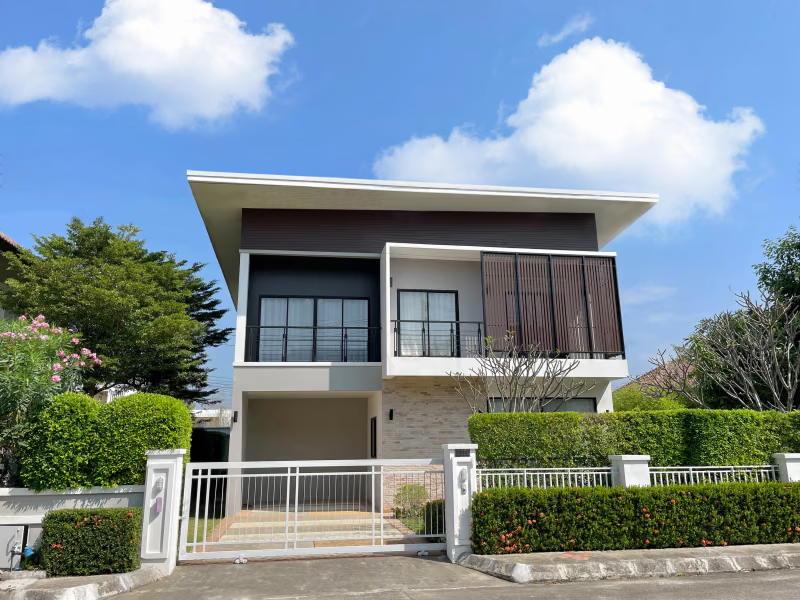
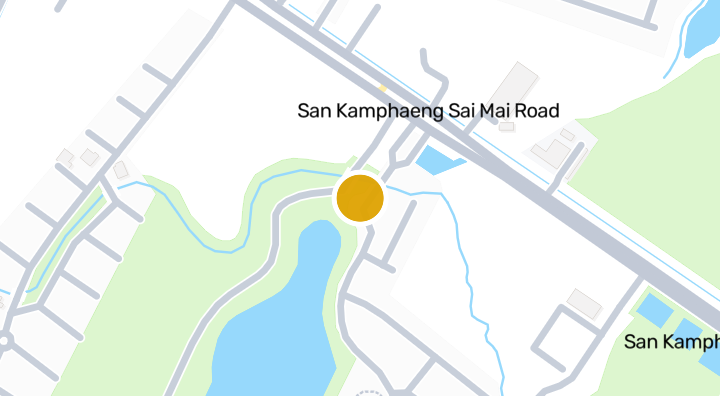
Inizio is a house project by Land & Houses, located in San Kamphaeng subdistrict, San Kamphaeng, Chiang Mai. The development offers amenities including a gym, a kids area, and a swimming pool. The project has 2 nearby hospitals. Nearby points of interest include the Sankampaeng Kilns attraction about 10 minutes away, Chiang Mai Airsport Airfield about 16 minutes away, Pang Pao Beach about 50 minutes away, and Kankanok1 clubhouse park approximately 875 meters away. Based on 11 recent transactions as of 2026-01-01, the median sale price is THB 5,500,000, or approximately THB 39,923 per square meter. The completion date has not been announced.

Voir les condos disponibles
Dans Inizio
Équipements
  • Espace enfants
  • Piscine
  • Salle de sport
Faits et statistiques

2017

Achèvement

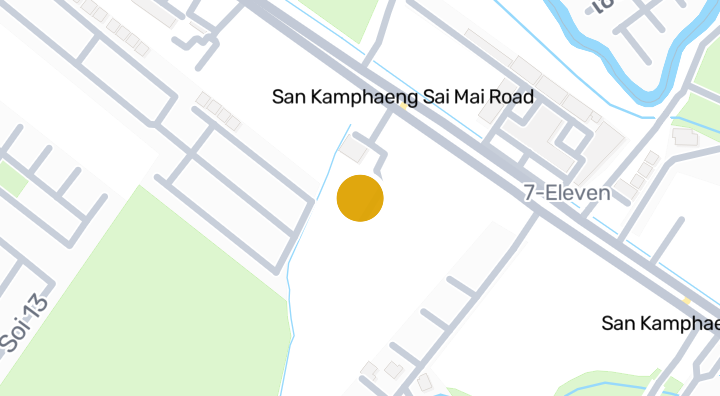
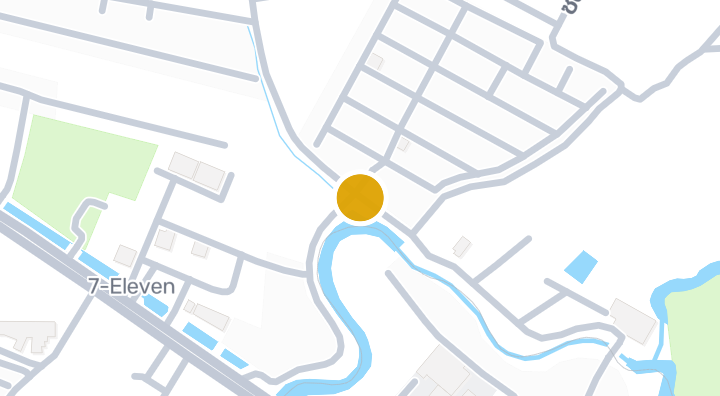
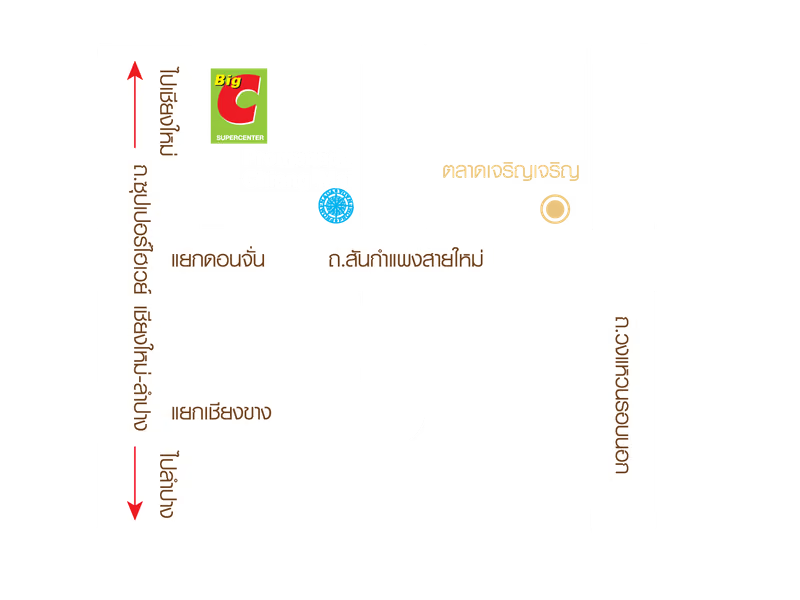
Emplacement

San Kamphaeng, Chiang Mai

16 min

vers Chiang Mai Airsport Airfield

trajet

10 min

San Kamphaeng, Chiang Mai

Vérifiez votre trajet

Enregistrez des lieux et comparez les temps de trajet depuis ce logement.

Quartier
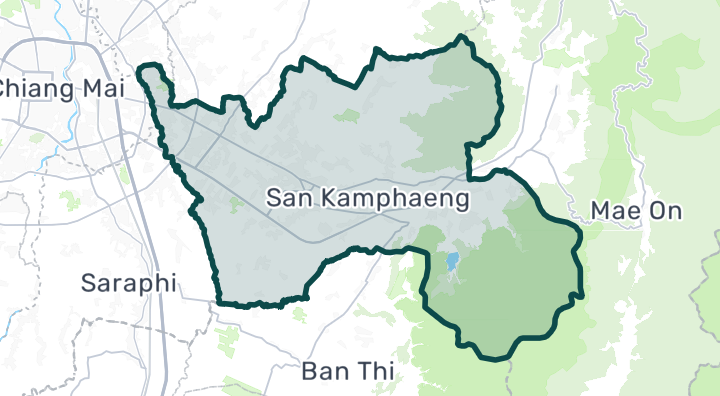
San Kamphaeng

San Kamphaeng

San Kamphaeng stretches east from Chiang Mai city toward the San Kamphaeng Hot Springs and the Borsang umbrella-making village. The district is known for traditional crafts — silk weaving, paper umbrellas, celadon pottery — and an authentically rural Northern Thai atmosphere. It's one of the most affordable areas near Chiang Mai, making it attractive for buyers wanting large plots of land. Rural Thai lifestyle with rice paddies, temples, and local markets San Kamphaeng Hot Springs — natural mineral springs and spa facilities Borsang village — traditional umbrella painting, popular tourist attraction 20-30 minutes to Chiang Mai city center via Route 1006 Among the most affordable near Chiang Mai. Houses: 2–5 million THB. Land: 1–3 million THB per rai. Rental houses: 8,000–20,000 THB/month. Great value for those comfortable with a more rural setting.

Découvrir San Kamphaeng

Risques et contexte du lieu

inondation fluvialeÉlevé(estimé)
crue soudaineDonnées insuffisantes(base non disponible)
sécheresseFaible(basé sur la zone environnante)
mauvaise qualité de l'airMoyen(observé)
risque d'incendieDonnées insuffisantes(base non disponible)
chaleur extrêmeDonnées insuffisantes(base non disponible)
Inondation fluviale
10e percentile régional de hauteur au-dessus du drainage : -1.6895067710374292 m. Décrit la zone, pas cette parcelle.
Portée des données: Contexte de la zone · Confiance : Faible
Crue soudaine
Aucune donnée exploitable disponible.
Portée des données: Données insuffisantes
Sécheresse
Les pluies étaient inférieures à la normale locale dans 9.444444444444445% des périodes de 10 jours analysées. Le classement régional utilise des seuils définis par le projet.
Portée des données: Contexte de la zone · Confiance : Moyen
Qualité de l’air
Moyenne annuelle de PM2.5 : 20.57780246767044 µg/m³, source : OpenAQ. Ce n’est pas une mesure actuelle.
Portée des données: Contexte de la zone · Confiance : Moyen
Incendie
Aucune donnée exploitable disponible.
Portée des données: Données insuffisantes
Chaleur
Aucune donnée exploitable disponible.
Portée des données: Données insuffisantes

Inondation

Inondation fluviale

Aucune observation satellite d'inondation ne couvre encore cet emplacement

Le risque d'inondation fluviale n'est évalué qu'à partir d'un seul événement d'inondation observé par satellite en 2024, couvrant quatre provinces du nord de la Thaïlande (Chiang Mai, Chiang Rai, Lamphun, Phayao). La mention « inconnu » ailleurs signifie qu'aucune observation n'existe encore — pas que la zone est sûre.

Crue soudaine

Pas encore évalué

Confiance : faible

  • Pente : 0.3%

Les données de terrain pour les crues soudaines proviennent des données de cours d'eau d'OpenStreetMap. Voir l'attribution OpenStreetMap

Contexte de la zone

Estimation officielle du coût de construction, maximum
13 000 THB/m² — Dans la province de Chiang Mai
Source : Treasury Department (กรมธนารักษ์) construction cost appraisal · Licence : Open Data Common (Treasury Department building valuation catalogue) · 2024-08-15 à 2027-12-31
Estimation officielle du coût de construction, typique
7 900 THB/m² — Dans la province de Chiang Mai
Source : Treasury Department (กรมธนารักษ์) construction cost appraisal · Licence : Open Data Common (Treasury Department building valuation catalogue) · 2024-08-15 à 2027-12-31
Estimation officielle du coût de construction, minimum
400 THB/m² — Dans la province de Chiang Mai
Source : Treasury Department (กรมธนารักษ์) construction cost appraisal · Licence : Open Data Common (Treasury Department building valuation catalogue) · 2024-08-15 à 2027-12-31
Estimation foncière officielle (municipale), maximum — valeur estimée officielle, pas un prix de marché
5 150 THB/sq_wah — Dans le sous-district de San Kamphaeng
Source : Treasury Department (กรมธนารักษ์) land valuation (ราคาประเมินที่ดิน) - attach_all_20240805.csv — เทศบาลตำบลสันกำแพง (municipal area) · Licence : Open Data Common · 2024-08-14 à 2024-08-14
Estimation foncière officielle (municipale), typique — valeur estimée officielle, pas un prix de marché
2 750 THB/sq_wah — Dans le sous-district de San Kamphaeng
Source : Treasury Department (กรมธนารักษ์) land valuation (ราคาประเมินที่ดิน) - attach_all_20240805.csv — เทศบาลตำบลสันกำแพง (municipal area) · Licence : Open Data Common · 2024-08-14 à 2024-08-14
Estimation foncière officielle (municipale), minimum — valeur estimée officielle, pas un prix de marché
1 000 THB/sq_wah — Dans le sous-district de San Kamphaeng
Source : Treasury Department (กรมธนารักษ์) land valuation (ราคาประเมินที่ดิน) - attach_all_20240805.csv — เทศบาลตำบลสันกำแพง (municipal area) · Licence : Open Data Common · 2024-08-14 à 2024-08-14
Estimation foncière officielle (sous-district), maximum — valeur estimée officielle, pas un prix de marché
12 000 THB/sq_wah — Dans le sous-district de San Kamphaeng
Source : Treasury Department (กรมธนารักษ์) land valuation (ราคาประเมินที่ดิน) - attach_all_20240805.csv · Licence : Open Data Common · 2024-08-14 à 2024-08-14
Estimation foncière officielle (sous-district), typique — valeur estimée officielle, pas un prix de marché
2 000 THB/sq_wah — Dans le sous-district de San Kamphaeng
Source : Treasury Department (กรมธนารักษ์) land valuation (ราคาประเมินที่ดิน) - attach_all_20240805.csv · Licence : Open Data Common · 2024-08-14 à 2024-08-14
Estimation foncière officielle (sous-district), minimum — valeur estimée officielle, pas un prix de marché
1 000 THB/sq_wah — Dans le sous-district de San Kamphaeng
Source : Treasury Department (กรมธนารักษ์) land valuation (ราคาประเมินที่ดิน) - attach_all_20240805.csv · Licence : Open Data Common · 2024-08-14 à 2024-08-14
Mois le plus sec
février — Dans la province de Chiang Mai
Source : Open-Meteo (ERA5 reanalysis, via archive-api.open-meteo.com) · Licence : CC BY 4.0 (Attribution 4.0 International) -- https://open-meteo.com/en/licence · 1991-01-01 à 2020-12-31
Climate rainfall annual total mean mm
2 060,3 mm — Dans la province de Chiang Mai
Source : Open-Meteo (ERA5 reanalysis, via archive-api.open-meteo.com) · Licence : CC BY 4.0 (Attribution 4.0 International) -- https://open-meteo.com/en/licence · 1991-01-01 à 2020-12-31
Mois le plus pluvieux
août — Dans la province de Chiang Mai
Source : Open-Meteo (ERA5 reanalysis, via archive-api.open-meteo.com) · Licence : CC BY 4.0 (Attribution 4.0 International) -- https://open-meteo.com/en/licence · 1991-01-01 à 2020-12-31
Hauteur au-dessus du drainage le plus proche (typique)
0 m — Dans le sous-district de San Kamphaeng
Source : Terrain-derived flash-flood indicators (HAND + slope + OSM drainage proximity; NOT a forecast or probability, not calibrated against observed events) from Copernicus DEM GLO-30 (via Mapterhorn terrain tiles) and OpenStreetMap waterway data. The banded metric flags whether the region CONTAINS terrain susceptible to flash flooding somewhere within it -- not the susceptibility of the region as a whole, and not of any individual property. · Licence : Copernicus WorldDEM-30 Licence, commercial use permitted (see ./region-elevation.ts's ELEVATION_SOURCE_LICENSE for the full citation) combined with OpenStreetMap contributors: ODbL 1.0 (https://www.openstreetmap.org/copyright) · 2010-12-12 à 2015-01-07
Hauteur au-dessus du drainage le plus proche (10% les plus bas)
-1,7 m — Dans le sous-district de San Kamphaeng
Source : Terrain-derived flash-flood indicators (HAND + slope + OSM drainage proximity; NOT a forecast or probability, not calibrated against observed events) from Copernicus DEM GLO-30 (via Mapterhorn terrain tiles) and OpenStreetMap waterway data. The banded metric flags whether the region CONTAINS terrain susceptible to flash flooding somewhere within it -- not the susceptibility of the region as a whole, and not of any individual property. · Licence : Copernicus WorldDEM-30 Licence, commercial use permitted (see ./region-elevation.ts's ELEVATION_SOURCE_LICENSE for the full citation) combined with OpenStreetMap contributors: ODbL 1.0 (https://www.openstreetmap.org/copyright) · 2010-12-12 à 2015-01-07
Pente du terrain (typique)
0,2% — Dans le sous-district de San Kamphaeng
Source : Terrain-derived flash-flood indicators (HAND + slope + OSM drainage proximity; NOT a forecast or probability, not calibrated against observed events) from Copernicus DEM GLO-30 (via Mapterhorn terrain tiles) and OpenStreetMap waterway data. The banded metric flags whether the region CONTAINS terrain susceptible to flash flooding somewhere within it -- not the susceptibility of the region as a whole, and not of any individual property. · Licence : Copernicus WorldDEM-30 Licence, commercial use permitted (see ./region-elevation.ts's ELEVATION_SOURCE_LICENSE for the full citation) combined with OpenStreetMap contributors: ODbL 1.0 (https://www.openstreetmap.org/copyright) · 2010-12-12 à 2015-01-07
Pente du terrain (10% les plus raides)
0,6% — Dans le sous-district de San Kamphaeng
Source : Terrain-derived flash-flood indicators (HAND + slope + OSM drainage proximity; NOT a forecast or probability, not calibrated against observed events) from Copernicus DEM GLO-30 (via Mapterhorn terrain tiles) and OpenStreetMap waterway data. The banded metric flags whether the region CONTAINS terrain susceptible to flash flooding somewhere within it -- not the susceptibility of the region as a whole, and not of any individual property. · Licence : Copernicus WorldDEM-30 Licence, commercial use permitted (see ./region-elevation.ts's ELEVATION_SOURCE_LICENSE for the full citation) combined with OpenStreetMap contributors: ODbL 1.0 (https://www.openstreetmap.org/copyright) · 2010-12-12 à 2015-01-07
Distance au cours d'eau le plus proche (typique)
222 m — Dans le sous-district de San Kamphaeng
Source : Terrain-derived flash-flood indicators (HAND + slope + OSM drainage proximity; NOT a forecast or probability, not calibrated against observed events) from Copernicus DEM GLO-30 (via Mapterhorn terrain tiles) and OpenStreetMap waterway data. The banded metric flags whether the region CONTAINS terrain susceptible to flash flooding somewhere within it -- not the susceptibility of the region as a whole, and not of any individual property. · Licence : Copernicus WorldDEM-30 Licence, commercial use permitted (see ./region-elevation.ts's ELEVATION_SOURCE_LICENSE for the full citation) combined with OpenStreetMap contributors: ODbL 1.0 (https://www.openstreetmap.org/copyright) · 2010-12-12 à 2015-01-07
Distance au cours d'eau le plus proche (10% les plus proches)
76,1 m — Dans le sous-district de San Kamphaeng
Source : Terrain-derived flash-flood indicators (HAND + slope + OSM drainage proximity; NOT a forecast or probability, not calibrated against observed events) from Copernicus DEM GLO-30 (via Mapterhorn terrain tiles) and OpenStreetMap waterway data. The banded metric flags whether the region CONTAINS terrain susceptible to flash flooding somewhere within it -- not the susceptibility of the region as a whole, and not of any individual property. · Licence : Copernicus WorldDEM-30 Licence, commercial use permitted (see ./region-elevation.ts's ELEVATION_SOURCE_LICENSE for the full citation) combined with OpenStreetMap contributors: ODbL 1.0 (https://www.openstreetmap.org/copyright) · 2010-12-12 à 2015-01-07
Sensibilité du terrain aux crues soudaines
modéré — Dans le sous-district de San Kamphaeng
Source : Terrain-derived flash-flood indicators (HAND + slope + OSM drainage proximity; NOT a forecast or probability, not calibrated against observed events) from Copernicus DEM GLO-30 (via Mapterhorn terrain tiles) and OpenStreetMap waterway data. The banded metric flags whether the region CONTAINS terrain susceptible to flash flooding somewhere within it -- not the susceptibility of the region as a whole, and not of any individual property. · Licence : Copernicus WorldDEM-30 Licence, commercial use permitted (see ./region-elevation.ts's ELEVATION_SOURCE_LICENSE for the full citation) combined with OpenStreetMap contributors: ODbL 1.0 (https://www.openstreetmap.org/copyright) · 2010-12-12 à 2015-01-07
Altitude, maximum
318,4 m — Dans le sous-district de San Kamphaeng
Source : Mapterhorn terrain tiles (Copernicus DEM GLO-30 / WorldDEM-30, terrarium encoding, via tiles.mapterhorn.com) · Licence : Copernicus WorldDEM-30 Licence (COP-DEM-GLO-30-F, 'Global 30m Full, Free & Open' -- https://documentation.dataspace.copernicus.eu/APIs/SentinelHub/Data/DEM/resources/license/License-COPDEM-30.pdf); free of charge, reproduction/distribution/public-communication/adaptation all granted, commercial use permitted; required notice: "produced using Copernicus WorldDEM-30 © DLR e.V. 2010-2014 and © Airbus Defence and Space GmbH 2014-2018 provided under COPERNICUS by the European Union and ESA; all rights reserved." Tiles served by Mapterhorn (© Mapterhorn, https://mapterhorn.com/attribution) -- both notices required. · 2010-12-12 à 2015-01-07
Altitude, typique
307,4 m — Dans le sous-district de San Kamphaeng
Source : Mapterhorn terrain tiles (Copernicus DEM GLO-30 / WorldDEM-30, terrarium encoding, via tiles.mapterhorn.com) · Licence : Copernicus WorldDEM-30 Licence (COP-DEM-GLO-30-F, 'Global 30m Full, Free & Open' -- https://documentation.dataspace.copernicus.eu/APIs/SentinelHub/Data/DEM/resources/license/License-COPDEM-30.pdf); free of charge, reproduction/distribution/public-communication/adaptation all granted, commercial use permitted; required notice: "produced using Copernicus WorldDEM-30 © DLR e.V. 2010-2014 and © Airbus Defence and Space GmbH 2014-2018 provided under COPERNICUS by the European Union and ESA; all rights reserved." Tiles served by Mapterhorn (© Mapterhorn, https://mapterhorn.com/attribution) -- both notices required. · 2010-12-12 à 2015-01-07
Altitude, minimum
298 m — Dans le sous-district de San Kamphaeng
Source : Mapterhorn terrain tiles (Copernicus DEM GLO-30 / WorldDEM-30, terrarium encoding, via tiles.mapterhorn.com) · Licence : Copernicus WorldDEM-30 Licence (COP-DEM-GLO-30-F, 'Global 30m Full, Free & Open' -- https://documentation.dataspace.copernicus.eu/APIs/SentinelHub/Data/DEM/resources/license/License-COPDEM-30.pdf); free of charge, reproduction/distribution/public-communication/adaptation all granted, commercial use permitted; required notice: "produced using Copernicus WorldDEM-30 © DLR e.V. 2010-2014 and © Airbus Defence and Space GmbH 2014-2018 provided under COPERNICUS by the European Union and ESA; all rights reserved." Tiles served by Mapterhorn (© Mapterhorn, https://mapterhorn.com/attribution) -- both notices required. · 2010-12-12 à 2015-01-07
Altitude, amplitude
20,4 m — Dans le sous-district de San Kamphaeng
Source : Mapterhorn terrain tiles (Copernicus DEM GLO-30 / WorldDEM-30, terrarium encoding, via tiles.mapterhorn.com) · Licence : Copernicus WorldDEM-30 Licence (COP-DEM-GLO-30-F, 'Global 30m Full, Free & Open' -- https://documentation.dataspace.copernicus.eu/APIs/SentinelHub/Data/DEM/resources/license/License-COPDEM-30.pdf); free of charge, reproduction/distribution/public-communication/adaptation all granted, commercial use permitted; required notice: "produced using Copernicus WorldDEM-30 © DLR e.V. 2010-2014 and © Airbus Defence and Space GmbH 2014-2018 provided under COPERNICUS by the European Union and ESA; all rights reserved." Tiles served by Mapterhorn (© Mapterhorn, https://mapterhorn.com/attribution) -- both notices required. · 2010-12-12 à 2015-01-07
Part des périodes de 10 jours en déficit pluviométrique (10 ans)
9,4% — Dans la province de Chiang Mai
Source : Climate Hazards Center UC Santa Barbara & WFP -- Thailand: Rainfall Indicators at Subnational Level (HDX) · Licence : CC BY (Creative Commons Attribution International) · 2016-01-01 à 2025-12-31
Pire déficit pluviométrique sur 3 mois (10 ans)
37,8% — Dans la province de Chiang Mai
Source : Climate Hazards Center UC Santa Barbara & WFP -- Thailand: Rainfall Indicators at Subnational Level (HDX) · Licence : CC BY (Creative Commons Attribution International) · 2016-01-01 à 2025-12-31
Part de la surface analysée, événement 2024
100% — Dans le sous-district de San Kamphaeng
Source : UNOSAT FL20240912THA -- Satellite detected water extents from 5 to 10 October 2024 over Chiang Mai and Lamphun Provinces (OBSERVED flood extent for ONE 2024 satellite pass -- not a general or future flood-risk indicator) · Licence : CC BY-SA (UNOSAT / United Nations Satellite Centre) · 2024-10-05 à 2024-10-10
Surface inondée observée, événement 2024
0,7 km2 — Dans le sous-district de San Kamphaeng
Source : UNOSAT FL20240912THA -- Satellite detected water extents from 5 to 10 October 2024 over Chiang Mai and Lamphun Provinces (OBSERVED flood extent for ONE 2024 satellite pass -- not a general or future flood-risk indicator) · Licence : CC BY-SA (UNOSAT / United Nations Satellite Centre) · 2024-10-05 à 2024-10-10
Part de la surface inondée, événement 2024
2,8% — Dans le sous-district de San Kamphaeng
Source : UNOSAT FL20240912THA -- Satellite detected water extents from 5 to 10 October 2024 over Chiang Mai and Lamphun Provinces (OBSERVED flood extent for ONE 2024 satellite pass -- not a general or future flood-risk indicator) · Licence : CC BY-SA (UNOSAT / United Nations Satellite Centre) · 2024-10-05 à 2024-10-10
Exposition aux inondations, événement 2024
modéré — Dans le sous-district de San Kamphaeng
Source : UNOSAT FL20240912THA -- Satellite detected water extents from 5 to 10 October 2024 over Chiang Mai and Lamphun Provinces (OBSERVED flood extent for ONE 2024 satellite pass -- not a general or future flood-risk indicator) · Licence : CC BY-SA (UNOSAT / United Nations Satellite Centre) · 2024-10-05 à 2024-10-10
PM2,5, moyenne annuelle (capteur à bas coût)
27,8 µg/m³ — Dans la province de Chiang Mai
Source : OpenAQ — ไดมอนด์.-2545166 (low-cost) · Licence : CC BY 4.0 (AirGradient via OpenAQ) · 2025-01-01 à 2026-01-01
PM2,5, moyenne annuelle
20,6 µg/m³ — Dans la province de Chiang Mai
Source : OpenAQ — NARIT ASTROPARK (Parking)-1224519 (reference) · Licence : CC BY 4.0 (AirGradient via OpenAQ) · 2025-01-01 à 2026-01-01
Précipitations des 3 derniers mois par rapport à la normale
102% — Dans la province de Chiang Mai
Source : Climate Hazards Center UC Santa Barbara & WFP -- Thailand: Rainfall Indicators at Subnational Level (HDX) · Licence : CC BY (Creative Commons Attribution International) · 2026-07-01 à 2026-09-21
En savoir plus sur cette zone

Cette analyse préliminaire ne constitue ni une garantie de sécurité, ni une prévision des risques futurs, ni une inspection sur place.

Statistiques du marché

D'après les annonces actives de ce projet

33 834 THB/m²

Prix de vente / m²

250 THB/m²

Prix de location / m²

10.78%

Rendement locatif brut

8.87%

Écart location/vente

Répartition des types de logements
ChambresAnnonces activesPrix de vente / m²Prix de location / m²
3 chambres134 745 000 THB44 000 THB
4 chambres3Pas encore assez de donnéesPas encore assez de données
5 chambres2Pas encore assez de donnéesPas encore assez de données

Promoteur

Land & Houses

Avis sur la propriété

Aucun avis pour le moment — soyez le premier à en laisser un.

Avis

Laisser un avis

Connexion requise. Un avis par projet.

Connectez-vous pour laisser un avis.

Disponible à la location

30,000 THB/mois

32114 m²51 wah²+12 mois
Inizio · San Kamphaeng

24,000 THB/mois

32114 m²51 wah²+12 mois
Inizio · San Kamphaeng

24,000 THB/mois

32114 m²51 wah²+12 mois
Inizio · San Kamphaeng

25,000 THB/mois

33160 m²60 wah²+12 mois
Inizio · San Kamphaeng
Voir les 10 locations

Disponible à la vente

24,000 THB/mois

32114 m²51 wah²+12 mois
Inizio · San Kamphaeng

24,000 THB/mois

32114 m²51 wah²+12 mois
Inizio · San Kamphaeng

4,300,000 THB

33120 m²60 wah²
Inizio · San Kamphaeng

5,190,000 THB

33130 m²78 wah²
Inizio · San Kamphaeng
Voir les 8 biens à vendre

Projets à proximité

Sivalai Village 3

Sivalai Village 3

Lotissement

Boonfah Grand Home 2 | Houses in Ton Pao, San Kamphaeng, Ch

Boonfah Grand Home 2 | Houses in Ton Pao, San Kamphaeng, Ch

Lotissement
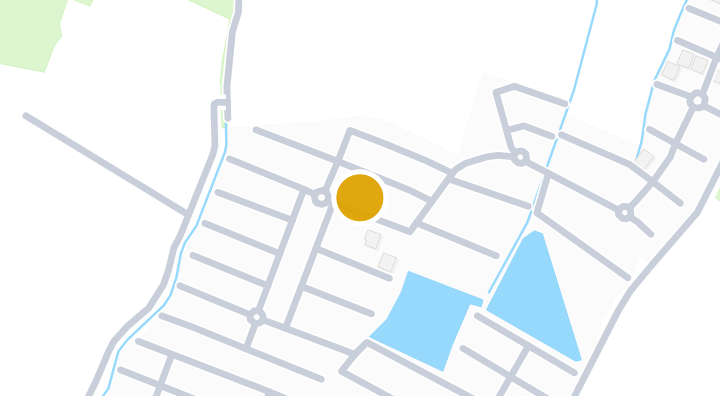
Prego Riverview

Prego Riverview

Lotissement

Koolpunt Ville 16 - The Bliss Houses for Sale in San Kampha

Koolpunt Ville 16 - The Bliss Houses for Sale in San Kampha

Lotissement
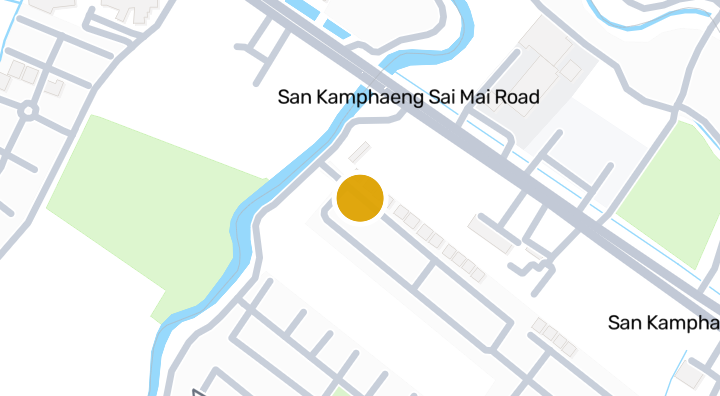
Grand Lanna Merridian - Houses in San Kamphaeng, Chiang Mai

Grand Lanna Merridian - Houses in San Kamphaeng, Chiang Mai

Lotissement
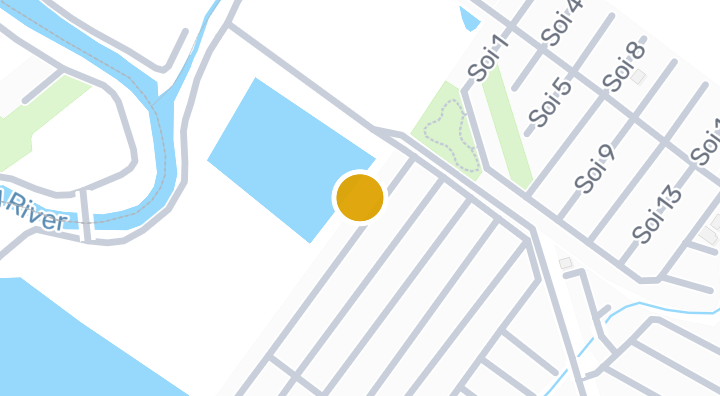
Karnkanok ville 5

Karnkanok ville 5

Lotissement

Karnkanok Ville 14 — Houses in San Kamphaeng, Chiang Mai

Karnkanok Ville 14 — Houses in San Kamphaeng, Chiang Mai

Lotissement
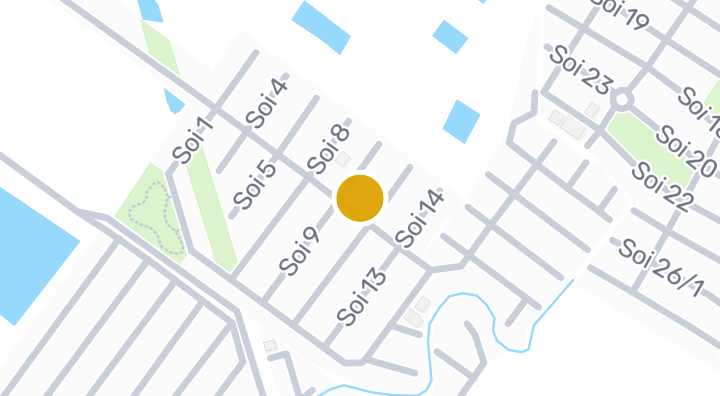
Karnkanok Ville 23 | Houses for Sale in San Kamphaeng, Ching

Karnkanok Ville 23 | Houses for Sale in San Kamphaeng, Ching

Lotissement
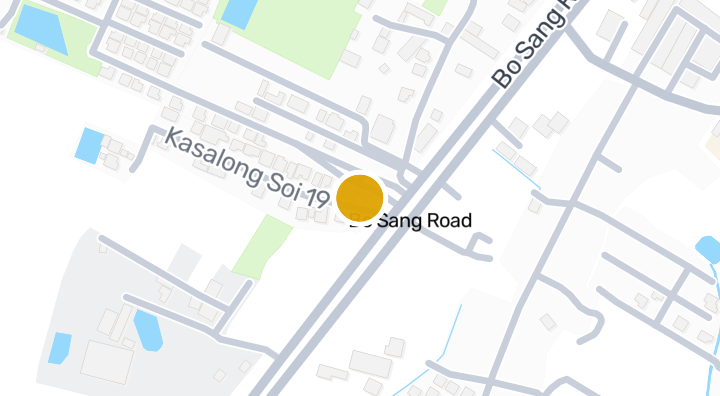
The Esteem - House Project in Ton Pao, San Kamphaeng, Chiang

The Esteem - House Project in Ton Pao, San Kamphaeng, Chiang

Lotissement
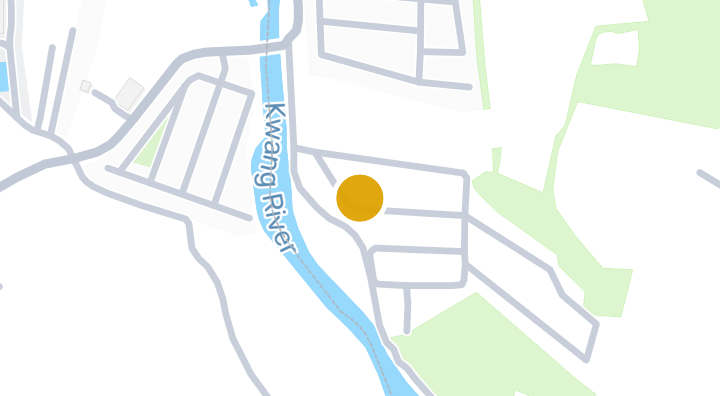
The City 5 - Houses for Sale in Ton Pao, San Kamphaeng, Ch

The City 5 - Houses for Sale in Ton Pao, San Kamphaeng, Ch

Lotissement
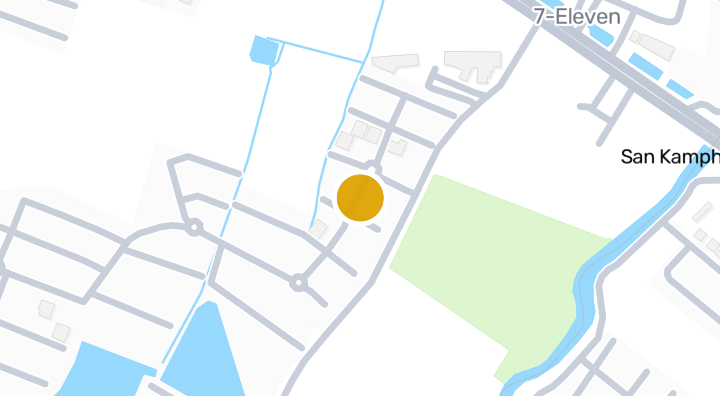
The Prego - House Project in Ton Pao, San Kamphaeng, Chiang

The Prego - House Project in Ton Pao, San Kamphaeng, Chiang

Lotissement
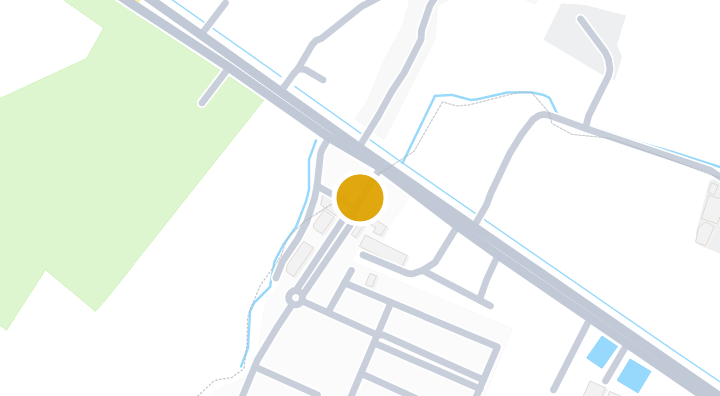
Malada Grand Coulee - House Project in Buak Khang, San Kampa

Malada Grand Coulee - House Project in Buak Khang, San Kampa

Lotissement

Soyez averti dès qu'une nouvelle unité est disponible dans Inizio.

Voir les condos disponibles
Dans Inizio

À découvrir aussi

  • Parcourir les biens

    BaanMe — votre plateforme de confiance pour les annonces immobilières, les analyses du marché et l'intelligence immobilière.

  • Explorer les 77 provinces de Thaïlande

    Utilisez la carte interactive pour passer de 77 provinces à 928 districts et 7 425 sous-districts, puis comparez logements, prix, projets et guides locaux.

  • Logements près des transports, écoles et sites d’intérêt

    Choisissez un lieu important pour votre quotidien, puis comparez les locations et biens à vendre à proximité. Chaque lieu ci-dessous dispose d’annonces actives dans sa zone de recherche.

  • Rapport sur le marché immobilier en Thaïlande

    Prix médians demandés pour toutes les annonces actives à Thaïlande, en bahts thaïlandais.