賃貸物件を探す

賃貸コンドミニアム

賃貸一戸建て

賃貸ヴィラ

賃貸アパート

物件を購入

販売コンドミニアム

販売一戸建て

販売ヴィラ

販売中の土地

探す

エリア

インタラクティブ地図で77県から928郡・7,425地区へ進み、地域の物件、価格、プロジェクト、エリアガイドを比較できます。

プロジェクトを探す

掲載中のコンドミニアム、住宅団地、開発プロジェクトを検索

交通機関・学校・ランドマーク周辺の住まい

毎日の暮らしで大切な場所を選び、周辺の最新の賃貸・売買物件を比較できます。以下の場所にはすべて検索範囲内に掲載中の物件があります。

所有者が承認した売却機会

価格を確認済みで、相談に応じる意思がある所有者の物件を探せます。売却を急いでいない所有者の物件も含まれます。

近くのエージェントを探す

県ごとに認証済みの不動産エージェント・仲介会社を、掲載中の物件やレビューとともに閲覧できます。

リソース

ガイドと市場情報

タイ不動産市場レポート

ネットワーク上でアクティブな掲載が最も多い県です。県をクリックすると詳細な市場レポートを表示します。

おすすめガイド

タイで購入・賃貸・生活するのに最適なエリアを厳選

ビザ情報

タイのビザ種類、延長、申請について

タイの不動産法

公式情報源で確認した、外国人購入者・タイ人購入者・賃借人向けのわかりやすいタイ不動産法ガイド。

タイ洪水履歴マップ

無料ツール:過去の衛星(SAR)による洪水観測データを使って、タイの住所、ソイ、コンドミニアムプロジェクトが過去に浸水したことがあるかを確認できます。

不動産ニュース

公式情報源で確認した、タイのビザ・税金・不動産法に関する最新情報。

すべての記事

お役立ち情報、市場動向、物件ガイド

ツール

タイ住宅ローン計算機

入力した物件価格、頭金、年利、返済期間から住宅ローンの毎月の返済額を試算します。

移転費用計算ツール

タイの不動産移転にかかる税金・費用を計算

単位換算

タイの土地単位と国際単位を換算

  • 賃貸コンドミニアム
  • 賃貸一戸建て
  • 賃貸ヴィラ
  • 賃貸アパート
  • 販売コンドミニアム
  • 販売一戸建て
  • 販売ヴィラ
  • 販売中の土地
  • エリア
  • プロジェクトを探す
  • 交通機関・学校・ランドマーク周辺の住まい
  • 所有者が承認した売却機会
  • 近くのエージェントを探す
  • タイ不動産市場レポート
  • おすすめガイド
  • ビザ情報
  • タイの不動産法
  • タイ洪水履歴マップ
  • 不動産ニュース
  • すべての記事
  • タイ住宅ローン計算機
  • 移転費用計算ツール
  • 単位換算

BaanMeが選ばれる理由

本人確認済みエージェント

BaanMeのエージェントは、掲載を開始する前にタイ政府発行のIDで本人確認を行います。取引相手が誰なのかが常に明確で、悪質な業者は永久に利用停止となります。

安全なアプリ内チャット(近日公開)

アプリ内メッセージ機能を開発中です。公開前の連絡方法は仲介業者と物件によって異なります。

デポジット保護(近日公開)

近日、BaanMeが敷金をエスクローで管理し、すべての請求内容を審査します。不当な減額やオーナーの音信不通といった問題を防ぎます。

契約サポート

署名前に、対応可能な契約言語と条件を仲介業者に確認してください。

環境への取り組み

私たちはあなたと私たち、そしてすべての人の環境を大切にしています。そのため、パーイ地域の森林再生に取り組む地元NGO「Conserve Natural Forests」と協力し、タイ・パーイの熱帯雨林再生に力を注いでいます。

地域

  • Bangkokの物件
  • Chiang Maiの物件
  • Samut Prakanの物件
  • Phetchabunの物件
  • Lamphunの物件
  • Nonthaburiの物件
  • Chiang Raiの物件
  • Chon Buriの物件

物件を探す

  • バンコクの賃貸コンドミニアム
  • バンコクの賃貸アパート
  • チェンマイの賃貸一戸建て
  • バンコクの賃貸オフィス
  • バンコクの賃貸倉庫
  • サムイ島の賃貸一戸建て
  • すべての物件 →

よくある質問

  • Thailand Property Market Trends 2026: A Selective Recovery
  • その他 →

BaanMe

  • BaanMeについて
  • 報道関係のお問い合わせ
  • ブランド素材
  • プライバシーポリシー
  • 利用規約
  • 地図の帰属について
  • ヘルプ
  • Google で BaanMe を優先ソースに追加
  • アカウントを削除

© Niklas Benjamin Muegge, 2026

  1. ホーム
  2. …
    1. Chiang Mai
    2. Hang Dong
  3. Chiang Mai
  4. Hang Dong
  5. Baan Tharn Ing Doi
Baan Tharn Ing Doi
概要施設ロケーションレビュー空室のあるコンドミニアム類似プロジェクト近くのプロジェクト

Baan Tharn Ing Doi

購入

฿5.9M – ฿6.8M

賃貸

฿50K – ฿80K

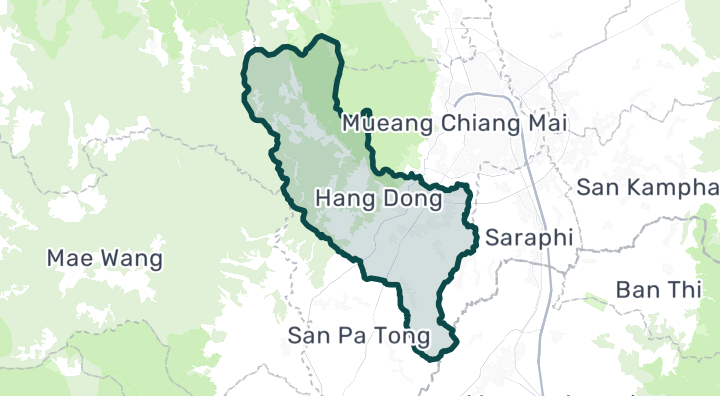
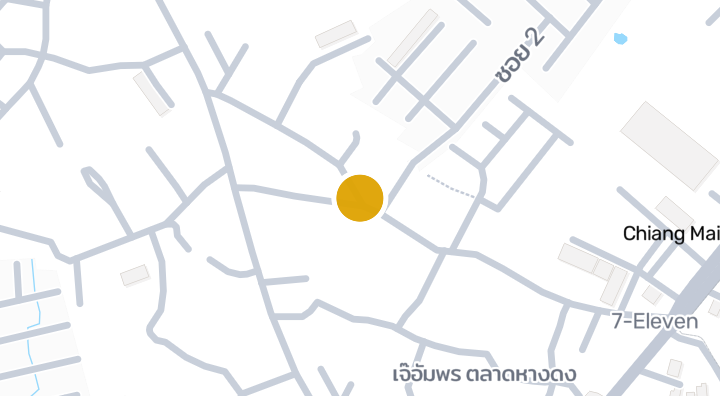
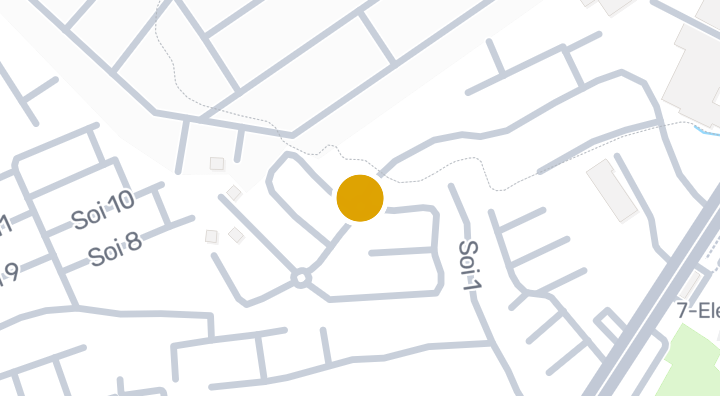
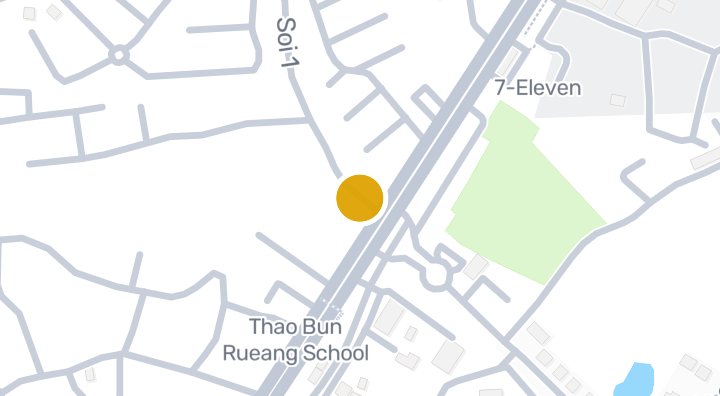
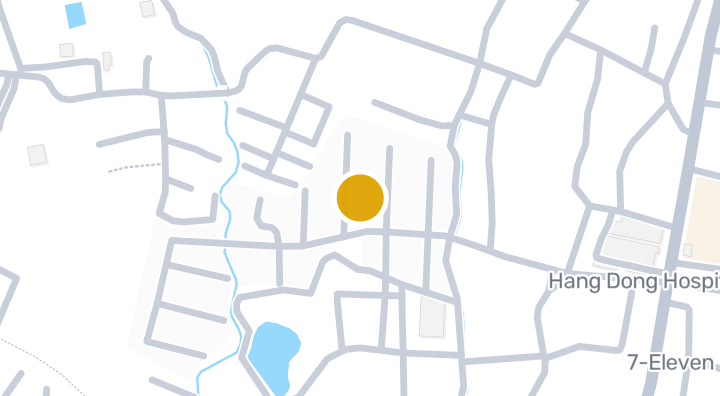
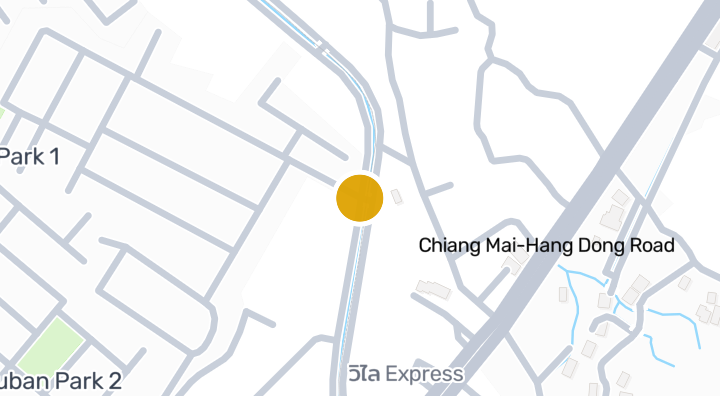
Baan Tharn Ing Doi is a house project located in Hang Dong, Hang Dong District, Chiang Mai Province. The project offers parking space for residents. Nearby, Muban Park 2 is about 392m away, Muban Park 1 is about 428m away, and Muban Park 3 is about 796m away. Ban Tawai, a local attraction, is roughly 6 minutes away, while Lamphun Airport is about 32 minutes away and Pang Pao Beach is about 52 minutes away.

空室のあるコンドミニアムを見る
Baan Tharn Ing Doi内
設備
  • 駐車スペース

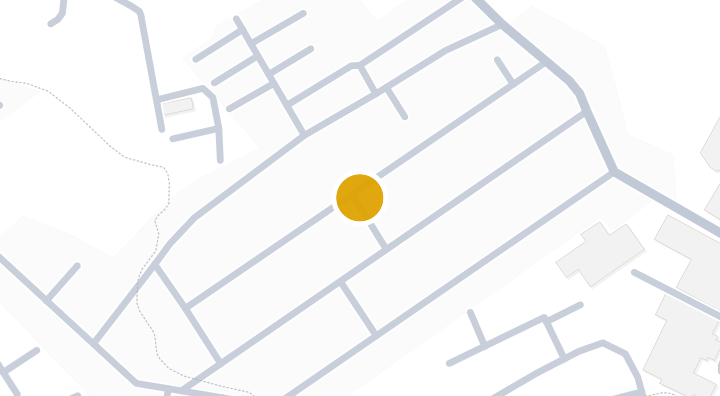
所在地

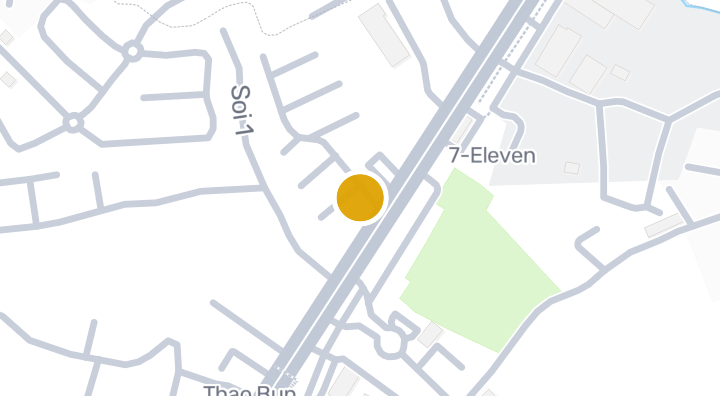
Hang Dong, Chiang Mai

近くに石灰岩カルスト地形があります(地質情報であり、リスク評価ではありません)

32分

Lamphun Airportまで

通勤時間

6分

Hang Dong, Chiang Mai

通勤時間を確認

場所を保存し、この物件からの所要時間を比較できます。

周辺エリア

Hang Dong

Hang Dong

Hang Dong is Chiang Mai's most popular suburban district, stretching south from the city toward the hills. It's where most expat families with children settle — close enough to the city for convenience, far enough for space, gardens, and clean air. The district has a pleasant mix of modern housing estates, traditional craft villages (especially woodcarving and lacquerware), and rural Thai life. Hang Dong is the top choice for expat families in Chiang Mai. Prem Tinsulanonda International School and Lanna International School are both in or near the district. Housing estates offer 3-4 bedroom homes with gardens and pools at prices that would barely buy a studio in Bangkok. The area is safe, quiet, and has a strong family expat community. Detached houses: 3–8 million THB (2-4 bed with garden). Larger luxury homes: 10–20 million THB. Rental houses: 15,000–40,000 THB/month. Land is still relatively affordable at 2–6 million THB per rai depending on road access and proximity to main roads.

Hang Dongを見る

立地のリスクと周辺情報

河川氾濫高(推定に基づく)
鉄砲水データ不足(根拠不明)
干ばつ低(周辺地域に基づく)
大気質の悪化中(実測に基づく)
火災リスクデータ不足(根拠不明)
猛暑データ不足(根拠不明)
河川洪水
地域の排水経路からの比高の第10百分位は -2.9471452315755187 m です。この敷地の値ではありません。
資料の対象範囲: 周辺地域の状況 · 信頼度:低
鉄砲水・急な洪水
分析に利用できる資料がありません。
資料の対象範囲: 根拠が不足しています
干ばつ
分析した10日間の期間の 9.444444444444445% で降雨が地域の平年値を下回りました。地域判定には本プロジェクトの基準を使用します。
資料の対象範囲: 周辺地域の状況 · 信頼度:中
大気質
PM2.5 の年平均は 20.57780246767044 µg/m³、出典は OpenAQ です。現在の大気質ではありません。
資料の対象範囲: 周辺地域の状況 · 信頼度:中
火災
分析に利用できる資料がありません。
資料の対象範囲: 根拠が不足しています
暑熱
分析に利用できる資料がありません。
資料の対象範囲: 根拠が不足しています

洪水

河川氾濫

この場所をカバーする衛星による洪水観測データはまだありません

河川氾濫リスクは、タイ北部の4県(チェンマイ、チェンライ、ランプーン、パヤオ)をカバーする2024年の単一の衛星観測イベントのみに基づいて評価されています。それ以外の地域で「未確認」と表示される場合、観測データがまだ存在しないことを意味し、安全であることを意味するものではありません。

鉄砲水

未評価

信頼度:低

  • 傾斜:0.5%

鉄砲水の地形データはOpenStreetMapの水路データに基づいています。 OpenStreetMapの帰属表示を見る

周辺エリア情報

政府建設コスト見積り(最大)
13,000 THB/m² — Chiang Mai県内
出典:Treasury Department (กรมธนารักษ์) construction cost appraisal · ライセンス:Open Data Common (Treasury Department building valuation catalogue) · 2024-08-15〜2027-12-31
政府建設コスト見積り(中央値)
7,900 THB/m² — Chiang Mai県内
出典:Treasury Department (กรมธนารักษ์) construction cost appraisal · ライセンス:Open Data Common (Treasury Department building valuation catalogue) · 2024-08-15〜2027-12-31
政府建設コスト見積り(最小)
400 THB/m² — Chiang Mai県内
出典:Treasury Department (กรมธนารักษ์) construction cost appraisal · ライセンス:Open Data Common (Treasury Department building valuation catalogue) · 2024-08-15〜2027-12-31
政府地価評価額(自治体)(最大)(実勢価格ではなく、税・登記費用算定用の評価額)
24,000 THB/sq_wah — Hang Dong地区内
出典:Treasury Department (กรมธนารักษ์) land valuation (ราคาประเมินที่ดิน) - attach_all_20240805.csv — เทศบาลตำบลหางดง (municipal area) · ライセンス:Open Data Common · 2024-08-14〜2024-08-14
政府地価評価額(自治体)(中央値)(実勢価格ではなく、税・登記費用算定用の評価額)
5,000 THB/sq_wah — Hang Dong地区内
出典:Treasury Department (กรมธนารักษ์) land valuation (ราคาประเมินที่ดิน) - attach_all_20240805.csv — เทศบาลตำบลหางดง (municipal area) · ライセンス:Open Data Common · 2024-08-14〜2024-08-14
政府地価評価額(自治体)(最小)(実勢価格ではなく、税・登記費用算定用の評価額)
2,000 THB/sq_wah — Hang Dong地区内
出典:Treasury Department (กรมธนารักษ์) land valuation (ราคาประเมินที่ดิน) - attach_all_20240805.csv — เทศบาลตำบลหางดง (municipal area) · ライセンス:Open Data Common · 2024-08-14〜2024-08-14
政府地価評価額(地区)(最大)(実勢価格ではなく、税・登記費用算定用の評価額)
6,000 THB/sq_wah — Hang Dong郡内
出典:Treasury Department (กรมธนารักษ์) land valuation (ราคาประเมินที่ดิน) - attach_all_20240805.csv · ライセンス:Open Data Common · 2024-08-14〜2024-08-14
政府地価評価額(地区)(中央値)(実勢価格ではなく、税・登記費用算定用の評価額)
2,500 THB/sq_wah — Hang Dong郡内
出典:Treasury Department (กรมธนารักษ์) land valuation (ราคาประเมินที่ดิน) - attach_all_20240805.csv · ライセンス:Open Data Common · 2024-08-14〜2024-08-14
政府地価評価額(地区)(最小)(実勢価格ではなく、税・登記費用算定用の評価額)
1,250 THB/sq_wah — Hang Dong郡内
出典:Treasury Department (กรมธนารักษ์) land valuation (ราคาประเมินที่ดิน) - attach_all_20240805.csv · ライセンス:Open Data Common · 2024-08-14〜2024-08-14
最も乾燥する月
2月 — Chiang Mai県内
出典:Open-Meteo (ERA5 reanalysis, via archive-api.open-meteo.com) · ライセンス:CC BY 4.0 (Attribution 4.0 International) -- https://open-meteo.com/en/licence · 1991-01-01〜2020-12-31
Climate rainfall annual total mean mm
2,060.3 mm — Chiang Mai県内
出典:Open-Meteo (ERA5 reanalysis, via archive-api.open-meteo.com) · ライセンス:CC BY 4.0 (Attribution 4.0 International) -- https://open-meteo.com/en/licence · 1991-01-01〜2020-12-31
最も雨の多い月
8月 — Chiang Mai県内
出典:Open-Meteo (ERA5 reanalysis, via archive-api.open-meteo.com) · ライセンス:CC BY 4.0 (Attribution 4.0 International) -- https://open-meteo.com/en/licence · 1991-01-01〜2020-12-31
最寄りの排水路からの高さ(中央値)
-1.1 m — Hang Dong地区内
出典:Terrain-derived flash-flood indicators (HAND + slope + OSM drainage proximity; NOT a forecast or probability, not calibrated against observed events) from Copernicus DEM GLO-30 (via Mapterhorn terrain tiles) and OpenStreetMap waterway data. The banded metric flags whether the region CONTAINS terrain susceptible to flash flooding somewhere within it -- not the susceptibility of the region as a whole, and not of any individual property. · ライセンス:Copernicus WorldDEM-30 Licence, commercial use permitted (see ./region-elevation.ts's ELEVATION_SOURCE_LICENSE for the full citation) combined with OpenStreetMap contributors: ODbL 1.0 (https://www.openstreetmap.org/copyright) · 2010-12-12〜2015-01-07
最寄りの排水路からの高さ(下位10%)
-2.9 m — Hang Dong地区内
出典:Terrain-derived flash-flood indicators (HAND + slope + OSM drainage proximity; NOT a forecast or probability, not calibrated against observed events) from Copernicus DEM GLO-30 (via Mapterhorn terrain tiles) and OpenStreetMap waterway data. The banded metric flags whether the region CONTAINS terrain susceptible to flash flooding somewhere within it -- not the susceptibility of the region as a whole, and not of any individual property. · ライセンス:Copernicus WorldDEM-30 Licence, commercial use permitted (see ./region-elevation.ts's ELEVATION_SOURCE_LICENSE for the full citation) combined with OpenStreetMap contributors: ODbL 1.0 (https://www.openstreetmap.org/copyright) · 2010-12-12〜2015-01-07
地形の傾斜(中央値)
0.5% — Hang Dong地区内
出典:Terrain-derived flash-flood indicators (HAND + slope + OSM drainage proximity; NOT a forecast or probability, not calibrated against observed events) from Copernicus DEM GLO-30 (via Mapterhorn terrain tiles) and OpenStreetMap waterway data. The banded metric flags whether the region CONTAINS terrain susceptible to flash flooding somewhere within it -- not the susceptibility of the region as a whole, and not of any individual property. · ライセンス:Copernicus WorldDEM-30 Licence, commercial use permitted (see ./region-elevation.ts's ELEVATION_SOURCE_LICENSE for the full citation) combined with OpenStreetMap contributors: ODbL 1.0 (https://www.openstreetmap.org/copyright) · 2010-12-12〜2015-01-07
地形の傾斜(急な方10%)
0.7% — Hang Dong地区内
出典:Terrain-derived flash-flood indicators (HAND + slope + OSM drainage proximity; NOT a forecast or probability, not calibrated against observed events) from Copernicus DEM GLO-30 (via Mapterhorn terrain tiles) and OpenStreetMap waterway data. The banded metric flags whether the region CONTAINS terrain susceptible to flash flooding somewhere within it -- not the susceptibility of the region as a whole, and not of any individual property. · ライセンス:Copernicus WorldDEM-30 Licence, commercial use permitted (see ./region-elevation.ts's ELEVATION_SOURCE_LICENSE for the full citation) combined with OpenStreetMap contributors: ODbL 1.0 (https://www.openstreetmap.org/copyright) · 2010-12-12〜2015-01-07
最寄りの水路までの距離(中央値)
466.4 m — Hang Dong地区内
出典:Terrain-derived flash-flood indicators (HAND + slope + OSM drainage proximity; NOT a forecast or probability, not calibrated against observed events) from Copernicus DEM GLO-30 (via Mapterhorn terrain tiles) and OpenStreetMap waterway data. The banded metric flags whether the region CONTAINS terrain susceptible to flash flooding somewhere within it -- not the susceptibility of the region as a whole, and not of any individual property. · ライセンス:Copernicus WorldDEM-30 Licence, commercial use permitted (see ./region-elevation.ts's ELEVATION_SOURCE_LICENSE for the full citation) combined with OpenStreetMap contributors: ODbL 1.0 (https://www.openstreetmap.org/copyright) · 2010-12-12〜2015-01-07
最寄りの水路までの距離(近い方10%)
67.9 m — Hang Dong地区内
出典:Terrain-derived flash-flood indicators (HAND + slope + OSM drainage proximity; NOT a forecast or probability, not calibrated against observed events) from Copernicus DEM GLO-30 (via Mapterhorn terrain tiles) and OpenStreetMap waterway data. The banded metric flags whether the region CONTAINS terrain susceptible to flash flooding somewhere within it -- not the susceptibility of the region as a whole, and not of any individual property. · ライセンス:Copernicus WorldDEM-30 Licence, commercial use permitted (see ./region-elevation.ts's ELEVATION_SOURCE_LICENSE for the full citation) combined with OpenStreetMap contributors: ODbL 1.0 (https://www.openstreetmap.org/copyright) · 2010-12-12〜2015-01-07
鉄砲水に対する地形の脆弱性
中 — Hang Dong地区内
出典:Terrain-derived flash-flood indicators (HAND + slope + OSM drainage proximity; NOT a forecast or probability, not calibrated against observed events) from Copernicus DEM GLO-30 (via Mapterhorn terrain tiles) and OpenStreetMap waterway data. The banded metric flags whether the region CONTAINS terrain susceptible to flash flooding somewhere within it -- not the susceptibility of the region as a whole, and not of any individual property. · ライセンス:Copernicus WorldDEM-30 Licence, commercial use permitted (see ./region-elevation.ts's ELEVATION_SOURCE_LICENSE for the full citation) combined with OpenStreetMap contributors: ODbL 1.0 (https://www.openstreetmap.org/copyright) · 2010-12-12〜2015-01-07
標高(最大)
322.2 m — Hang Dong地区内
出典:Mapterhorn terrain tiles (Copernicus DEM GLO-30 / WorldDEM-30, terrarium encoding, via tiles.mapterhorn.com) · ライセンス:Copernicus WorldDEM-30 Licence (COP-DEM-GLO-30-F, 'Global 30m Full, Free & Open' -- https://documentation.dataspace.copernicus.eu/APIs/SentinelHub/Data/DEM/resources/license/License-COPDEM-30.pdf); free of charge, reproduction/distribution/public-communication/adaptation all granted, commercial use permitted; required notice: "produced using Copernicus WorldDEM-30 © DLR e.V. 2010-2014 and © Airbus Defence and Space GmbH 2014-2018 provided under COPERNICUS by the European Union and ESA; all rights reserved." Tiles served by Mapterhorn (© Mapterhorn, https://mapterhorn.com/attribution) -- both notices required. · 2010-12-12〜2015-01-07
標高(中央値)
312.5 m — Hang Dong地区内
出典:Mapterhorn terrain tiles (Copernicus DEM GLO-30 / WorldDEM-30, terrarium encoding, via tiles.mapterhorn.com) · ライセンス:Copernicus WorldDEM-30 Licence (COP-DEM-GLO-30-F, 'Global 30m Full, Free & Open' -- https://documentation.dataspace.copernicus.eu/APIs/SentinelHub/Data/DEM/resources/license/License-COPDEM-30.pdf); free of charge, reproduction/distribution/public-communication/adaptation all granted, commercial use permitted; required notice: "produced using Copernicus WorldDEM-30 © DLR e.V. 2010-2014 and © Airbus Defence and Space GmbH 2014-2018 provided under COPERNICUS by the European Union and ESA; all rights reserved." Tiles served by Mapterhorn (© Mapterhorn, https://mapterhorn.com/attribution) -- both notices required. · 2010-12-12〜2015-01-07
標高(最小)
307.9 m — Hang Dong地区内
出典:Mapterhorn terrain tiles (Copernicus DEM GLO-30 / WorldDEM-30, terrarium encoding, via tiles.mapterhorn.com) · ライセンス:Copernicus WorldDEM-30 Licence (COP-DEM-GLO-30-F, 'Global 30m Full, Free & Open' -- https://documentation.dataspace.copernicus.eu/APIs/SentinelHub/Data/DEM/resources/license/License-COPDEM-30.pdf); free of charge, reproduction/distribution/public-communication/adaptation all granted, commercial use permitted; required notice: "produced using Copernicus WorldDEM-30 © DLR e.V. 2010-2014 and © Airbus Defence and Space GmbH 2014-2018 provided under COPERNICUS by the European Union and ESA; all rights reserved." Tiles served by Mapterhorn (© Mapterhorn, https://mapterhorn.com/attribution) -- both notices required. · 2010-12-12〜2015-01-07
標高(範囲)
14.3 m — Hang Dong地区内
出典:Mapterhorn terrain tiles (Copernicus DEM GLO-30 / WorldDEM-30, terrarium encoding, via tiles.mapterhorn.com) · ライセンス:Copernicus WorldDEM-30 Licence (COP-DEM-GLO-30-F, 'Global 30m Full, Free & Open' -- https://documentation.dataspace.copernicus.eu/APIs/SentinelHub/Data/DEM/resources/license/License-COPDEM-30.pdf); free of charge, reproduction/distribution/public-communication/adaptation all granted, commercial use permitted; required notice: "produced using Copernicus WorldDEM-30 © DLR e.V. 2010-2014 and © Airbus Defence and Space GmbH 2014-2018 provided under COPERNICUS by the European Union and ESA; all rights reserved." Tiles served by Mapterhorn (© Mapterhorn, https://mapterhorn.com/attribution) -- both notices required. · 2010-12-12〜2015-01-07
10日間単位での降水不足の割合(過去10年)
9.4% — Hang Dong郡内
出典:Climate Hazards Center UC Santa Barbara & WFP -- Thailand: Rainfall Indicators at Subnational Level (HDX) · ライセンス:CC BY (Creative Commons Attribution International) · 2016-01-01〜2025-12-31
過去10年で最悪の3か月降水不足
32.1% — Hang Dong郡内
出典:Climate Hazards Center UC Santa Barbara & WFP -- Thailand: Rainfall Indicators at Subnational Level (HDX) · ライセンス:CC BY (Creative Commons Attribution International) · 2016-01-01〜2025-12-31
分析済み面積の割合(2024年イベント)
100% — Hang Dong地区内
出典:UNOSAT FL20240912THA -- Satellite detected water extents from 5 to 10 October 2024 over Chiang Mai and Lamphun Provinces (OBSERVED flood extent for ONE 2024 satellite pass -- not a general or future flood-risk indicator) · ライセンス:CC BY-SA (UNOSAT / United Nations Satellite Centre) · 2024-10-05〜2024-10-10
観測された浸水面積(2024年イベント)
0 km2 — Hang Dong地区内
出典:UNOSAT FL20240912THA -- Satellite detected water extents from 5 to 10 October 2024 over Chiang Mai and Lamphun Provinces (OBSERVED flood extent for ONE 2024 satellite pass -- not a general or future flood-risk indicator) · ライセンス:CC BY-SA (UNOSAT / United Nations Satellite Centre) · 2024-10-05〜2024-10-10
浸水面積の割合(2024年イベント)
0% — Hang Dong地区内
出典:UNOSAT FL20240912THA -- Satellite detected water extents from 5 to 10 October 2024 over Chiang Mai and Lamphun Provinces (OBSERVED flood extent for ONE 2024 satellite pass -- not a general or future flood-risk indicator) · ライセンス:CC BY-SA (UNOSAT / United Nations Satellite Centre) · 2024-10-05〜2024-10-10
洪水リスク(2024年イベント)
観測なし — Hang Dong地区内
出典:UNOSAT FL20240912THA -- Satellite detected water extents from 5 to 10 October 2024 over Chiang Mai and Lamphun Provinces (OBSERVED flood extent for ONE 2024 satellite pass -- not a general or future flood-risk indicator) · ライセンス:CC BY-SA (UNOSAT / United Nations Satellite Centre) · 2024-10-05〜2024-10-10
PM2.5 年平均値(低価格センサー)
27.8 µg/m³ — Chiang Mai県内
出典:OpenAQ — ไดมอนด์.-2545166 (low-cost) · ライセンス:CC BY 4.0 (AirGradient via OpenAQ) · 2025-01-01〜2026-01-01
PM2.5 年平均値
20.6 µg/m³ — Chiang Mai県内
出典:OpenAQ — NARIT ASTROPARK (Parking)-1224519 (reference) · ライセンス:CC BY 4.0 (AirGradient via OpenAQ) · 2025-01-01〜2026-01-01
直近3か月の降水量(平年比)
102% — Hang Dong郡内
出典:Climate Hazards Center UC Santa Barbara & WFP -- Thailand: Rainfall Indicators at Subnational Level (HDX) · ライセンス:CC BY (Creative Commons Attribution International) · 2026-07-01〜2026-09-21
このエリアの詳細を見る

スクリーニング資料は、安全の保証、将来のリスク予測、現地調査ではありません。

市場統計

このプロジェクトの現在の掲載情報に基づく

データが不足しています

㎡あたり販売価格

データが不足しています

㎡あたり賃料

データが不足しています

グロス利回り

データが不足しています

賃料と販売価格の差

ユニット構成
ユニット構成
ベッドルーム数掲載件数㎡あたり販売価格㎡あたり賃料
3ベッドルーム4データが不足していますデータが不足しています
4ベッドルーム1データが不足していますデータが不足しています

よくある質問

物件レビュー

まだレビューがありません。最初のレビューを投稿しましょう。

レビュー

レビューを書く

サインインが必要です。1つのプロジェクトにつきレビューは1件まで。

レビューを投稿するにはサインインしてください。

賃貸可能

50,000 THB/月

33200 m²140 ワー²12ヶ月以上
Baan Tharn Ing Doi · Hang Dong

50,000 THB/月

33200 m²140 ワー²12ヶ月以上
Baan Tharn Ing Doi · Hang Dong

50,000 THB/月

32120 m²94 ワー²12ヶ月以上
Baan Tharn Ing Doi · Hang Dong

50,000 THB/月

32120 m²94 ワー²12ヶ月以上
Baan Tharn Ing Doi · Hang Dong

販売可能

50,000 THB/月

33200 m²140 ワー²12ヶ月以上
Baan Tharn Ing Doi · Hang Dong

50,000 THB/月

33200 m²140 ワー²12ヶ月以上
Baan Tharn Ing Doi · Hang Dong

50,000 THB/月

32120 m²94 ワー²12ヶ月以上
Baan Tharn Ing Doi · Hang Dong

50,000 THB/月

32120 m²94 ワー²12ヶ月以上
Baan Tharn Ing Doi · Hang Dong

近くのプロジェクト

Rung Arun 3 - Houses in Hang Dong, Chiang Mai

Rung Arun 3 - Houses in Hang Dong, Chiang Mai

住宅街
Ban Than Dong - House Project in Ban Waen, Hang Dong, Chiang

Ban Than Dong - House Project in Ban Waen, Hang Dong, Chiang

住宅街
Rung Arun Ville - House Project in Ban Waen, Hang Dong, Chia

Rung Arun Ville - House Project in Ban Waen, Hang Dong, Chia

住宅街
Tara Keree 2

Tara Keree 2

住宅街

Mantana Village

Mantana Village

住宅街

Khumpraya Garden Home

Khumpraya Garden Home

住宅街

Moo Baan Chiang Mai View Doi

Moo Baan Chiang Mai View Doi

住宅街

Somwang Village 2 - Houses in Hang Dong, Chiang Mai

Somwang Village 2 - Houses in Hang Dong, Chiang Mai

住宅街

Supalai Park Ville Hang Dong | Houses in Ban Waen, Hang Dong

Supalai Park Ville Hang Dong | Houses in Ban Waen, Hang Dong

住宅街
Baan Parichat - House Project in Hang Dong, Chiang Mai

Baan Parichat - House Project in Hang Dong, Chiang Mai

住宅街
Rung Arun Harmony - Houses in Ban Waen, Hang Dong, Chiangmai

Rung Arun Harmony - Houses in Ban Waen, Hang Dong, Chiangmai

住宅街
Palm Springs Privato - Houses in Ban Waen, Hang Dong, Chiang

Palm Springs Privato - Houses in Ban Waen, Hang Dong, Chiang

住宅街

Baan Tharn Ing Doiで新しいユニットが空いたら通知します。

空室のあるコンドミニアムを見る
Baan Tharn Ing Doi内

もっと見る

  • 物件を探す

    BaanMe — タイの不動産情報、市場データ、物件掲載を提供する信頼のプラットフォーム。

  • タイ全77県を探索

    インタラクティブ地図で77県から928郡・7,425地区へ進み、地域の物件、価格、プロジェクト、エリアガイドを比較できます。

  • 交通機関・学校・ランドマーク周辺の住まい

    毎日の暮らしで大切な場所を選び、周辺の最新の賃貸・売買物件を比較できます。以下の場所にはすべて検索範囲内に掲載中の物件があります。

  • タイ不動産市場レポート

    タイの全アクティブ物件における中央希望価格(タイバーツ)。